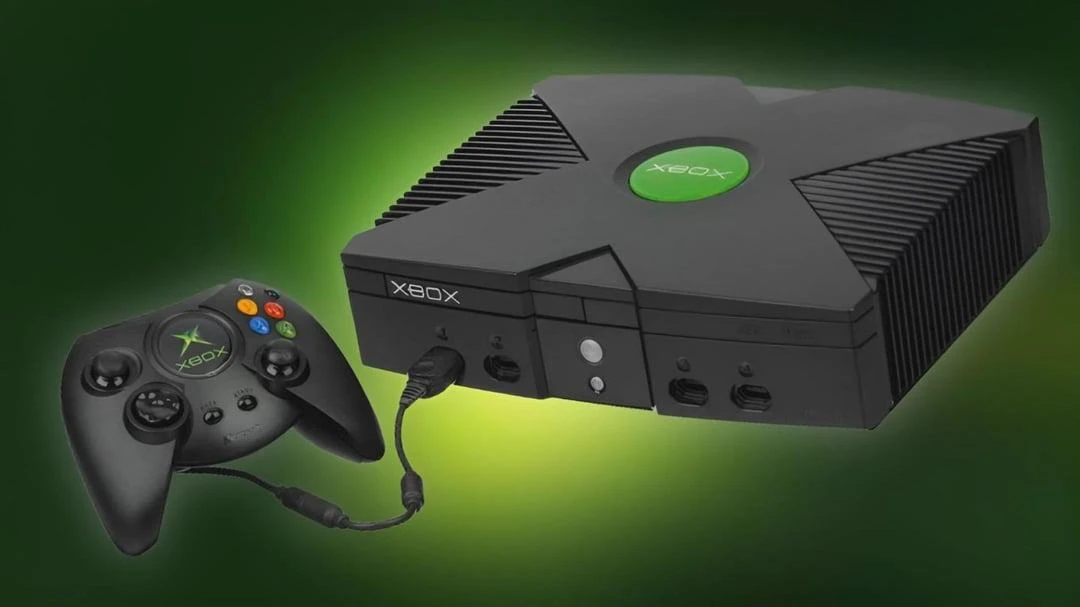
Microsoft Xbox (2001)
A 'technology push' device that stuck the landing.
Read case study →Guiding questionHow do designers approach problem-solving?
The five-phase design process is the skeleton of this course and of your IA. It is also what students are most tempted to treat as a formality, a set of headings written above work they had already decided to do. That is a waste, because the claim the model actually makes is uncomfortable and useful: you are not allowed to know the answer at the start. Empathise before you define, define before you ideate, and let each phase genuinely change what you do next.
You have almost certainly met a version of this in MYP, so the temptation is to skim. What is different here is the weight placed on iteration and evidence. Fifteen objectives looks like a lot, but they are largely one idea repeated at different scales: make a decision, test it, discover you were partly wrong, and record what changed. Designers who work this way are not slower. They fail on paper instead of in production, and a design process that shows real changes of mind will always beat one describing a straight line from problem to solution.
Students must be able toOutline each stage of the design process (empathize; defining the project; ideation and modelling; designing a solution; presenting a solution).
The design process is an iterative, human-centred framework comprising five phases:
The process is iterative, not linear. Designers regularly cycle back to earlier phases as new information emerges: re-empathising after a prototype test reveals an unexpected user need, or redefining specifications when a material constraint changes the problem.
A 'technology push' device that stuck the landing.
Read case study →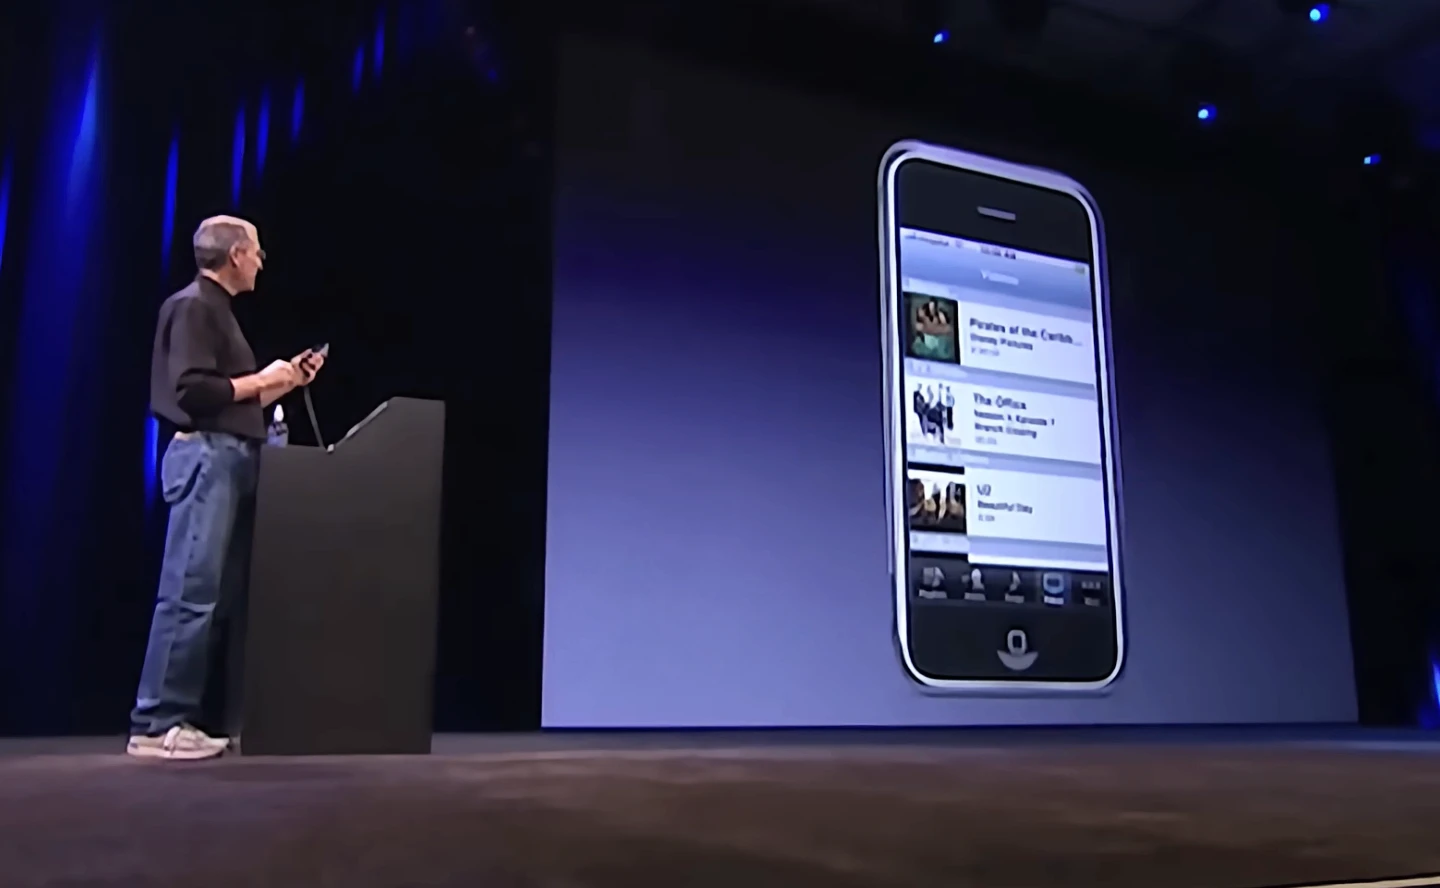
The 'One Device' to rule them all.
Read case study →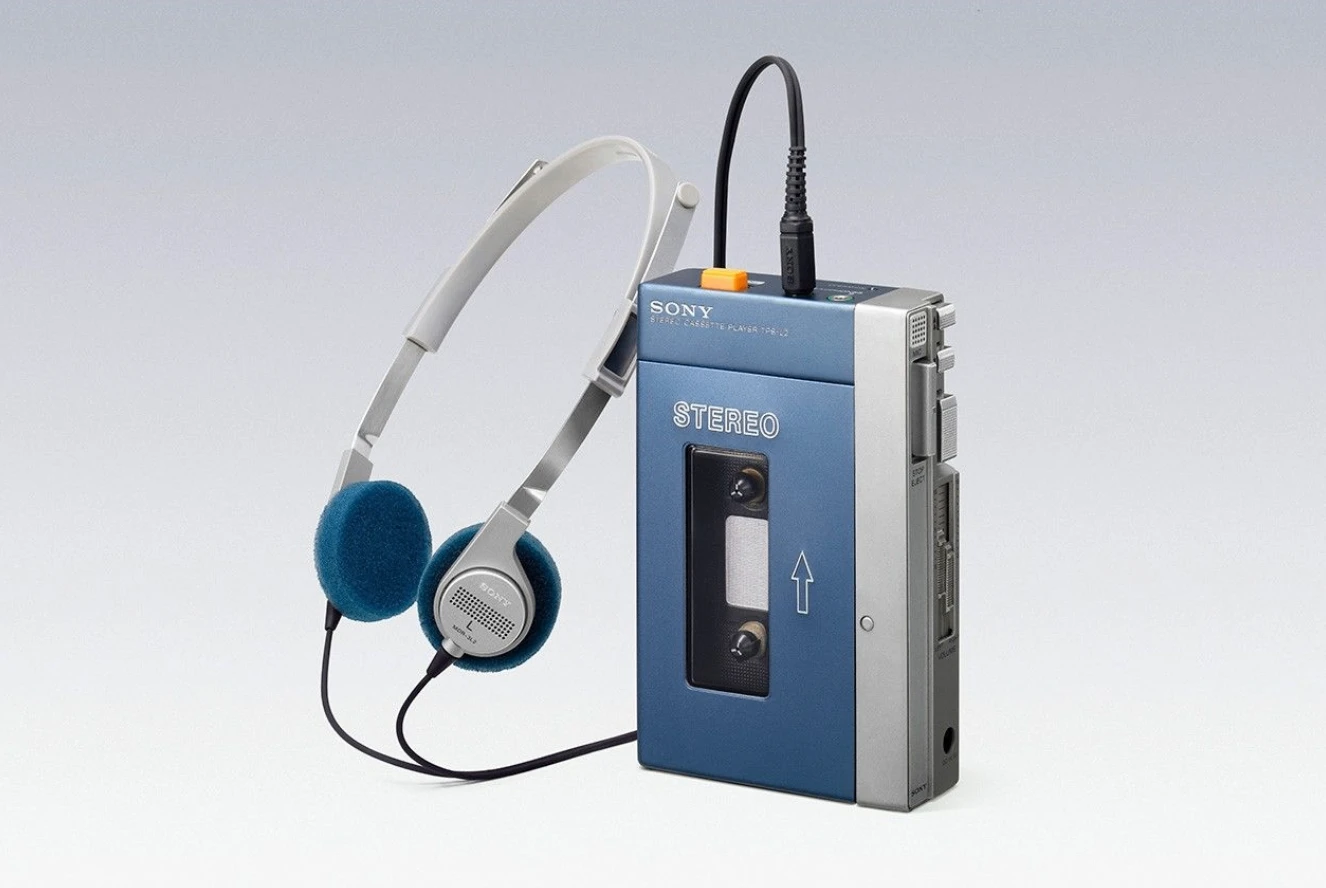
The creation of a revolutionary personal music player.
Read case study →Students must be able toDistinguish between primary and secondary sources, qualitative and quantitative data and how they are used to identify design opportunities, develop an understanding of users and generate ideas for solutions to problems.
Research is not a one-off activity at the start of a project; it runs throughout every phase of the design process. Designers collect data to identify opportunities, understand users, generate ideas and validate solutions. Two fundamental distinctions structure all design research:
Primary vs Secondary research:
Qualitative vs Quantitative data:
Effective design research combines both types: qualitative data explains the problem; quantitative data measures progress toward solving it.
Students must be able toApply primary research methods to gather first-hand data (user observations, interviews, surveys, questionnaires, focus groups, material testing and product analysis) and analyse the data to establish user requirements and design specifications, develop a persona and suggest further developments of a solution.
Primary research produces first-hand data that is specific to your design context and your users. Common methods include:
Primary data is authentic and directly relevant to your project, but it requires time, access to users and ethical consideration, particularly when working with minors or vulnerable groups.
Students must be able toAnalyse secondary data sources (internet-based research, government data and statistics research, university research and literature search) to establish user requirements and design specifications, develop a persona and suggest further developments for a solution.
Secondary research uses data collected and published by others. Designers turn to secondary sources to build background knowledge, validate primary findings, and access data at scales impossible to collect directly.
Common secondary sources in design include:
The key limitation of secondary research is relevance: data collected for a different purpose, population or context may not match your design situation. Secondary research should support (not replace) primary research.
Students must be able toIdentify issues, problems and challenges using user-centred research methods and techniques, and to identify user needs for specific user groups to understand their experience, motivations and interactions with products and environments.
A persona is a research-based fictional character that represents a specific group of end-users. Unlike marketing demographics (age, gender, income), an effective persona captures the full human picture: goals and motivations, frustrations and pain points, behaviours and daily routines, and the context in which they interact with products.
Personas serve two critical functions: they focus the design team on real human needs rather than assumed needs, and they prevent "design by committee" where everyone designs for themselves.
The demographics trap: Demographics alone are not enough. I'm sure you'd agree that it would be difficult to design something for all students at our school that all students would find useful or desirable. You all have your own tastes, interests, and preferences- even though you're a narrow demographic. The same thing applies to other user groups as well. We can't simply say "He's a Chinese man in his 30's, so we already know everything he wants and needs." That detail tells us some things about him, but there's far more to the persona than mere demographics.
Demographics tell you who someone is categorically, not what they need or how they behave. Effective personas require psychographic data: values, attitudes, lifestyle and context of use.
Psychographic data describes a person's values, attitudes, interests, lifestyle and motivations, the internal factors that shape how they think and behave. It sits alongside demographic data (age, gender, income, location) but answers a different question: demographics describe who someone is categorically, while psychographics describe why they make the choices they make.
Two users with identical demographics can have opposite psychographics. Two retired adults of the same age, income and location might differ completely: one is risk-averse and values routine, the other is adventurous and seeks novelty. A persona built only from demographic data would treat them as the same user; psychographic data is what makes a persona specific enough to design for.
Students must be able toMap a user's journey using a storyboard and identify pain points within that journey that provide design opportunities.
User observation involves watching users perform real tasks in their actual environment: a technique that reveals behaviours, workarounds and frustrations that users themselves may not consciously recognise or articulate in an interview.
A storyboard is a visual tool used to map a user's journey through a product experience or task sequence. Like a comic strip, it breaks the journey into discrete frames: each showing the user, their action, their environment and their emotional state at that moment. Storyboards make user journeys visible, shareable and open to critique within the design team.
Pain points are moments in the journey where the user experiences friction, frustration or failure. They are design opportunities: each pain point is a place where a better design could improve the experience. A storyboard is an effective tool for identifying and communicating pain points because it preserves the sequence and context of the problem, not just the problem itself.
After a trip to the grocery store a user places their groceries into the refrigerator.
The user places bottles on the door shelves, and discovers that the door doesn't close properly.
It is discovered that the door sags at a much lower weight than expected, slowly releasing cold air.
Designers try a variety of solutions, but even with much stronger hinges the door isn't sitting right. They try making smaller shelves, which increases the space available beyond the door.
The user once again moves their groceries into the refrigerator, but this time the door closes properly- and they still have space for large bottles.
The initial experience left the user frustrated, and while they may have preferred to have space in the door for bottles, the revision provided more room and fixed the improper seal.
Students must be able toAnalyse a range of products that either provides a solution to a problem or can inspire a solution to a problem.
Product analysis is a structured examination of an existing product to understand how it solves (or fails to solve) a problem. It is used during both the Empathise phase (understanding the current state of the world) and the Ideate phase (finding inspiration for new solutions).
A thorough product analysis examines:
Product analysis produces data that feeds directly into design specifications: what this product does well that must be matched, and where it fails that the new design must address.
Students must be able toExplain the nature of a problem by writing a problem statement that clearly defines their design intentions.
The first and most critical step in moving from Empathise to Define is writing a clear problem statement. A problem statement answers: who is experiencing what difficulty, in what context, and why does it matter?
A well-formed problem statement:
Design intention is the goal the solution must achieve, derived directly from the problem statement. Clear design intentions make subsequent decisions (about materials, features and form) much easier to justify: a feature either serves the design intention or it doesn't. Without a precise problem statement, every design decision becomes arbitrary.
Students must be able toConstruct design specifications based on primary and secondary research that communicate the essential and desirable success criteria of the redesigned product.
A design brief is the formal document produced at the end of the Define phase. It translates the problem statement into actionable direction and aligns all stakeholders (client, designers, engineers and manufacturers) around what the solution must achieve.
A design brief typically includes:
Specifications are divided into essential criteria (must be met; non-negotiable) and desirable criteria (would improve the product but are optional and can be traded against cost or time). Without clear specifications, it is impossible to evaluate whether any design iteration has succeeded.
Members of the school's tabletop gaming club paint their Warhammer miniatures on shared classroom tables during a weekly one-hour session, and they carry their paints, brushes and unfinished models to and from school in shoeboxes, tackle boxes and carrier bags. Observation of six members across three sessions found that an average of 14 minutes per session was spent unpacking and packing away, and interviews revealed that four of the six had damaged a drying model or bent a brush tip on the journey home. Paint pots carried on their sides leak and dry out, which club members described as the most expensive part of the hobby. A product analysis of commercial paint racks and miniature carry cases showed that the racks store paint well but are designed to stay on a desk at home, while the carry cases protect finished models but have no space for tools and no surface to work on.
The intention is to design a single box that holds a hobbyist's complete painting kit and opens out into a ready-to-use painting station, so that a club member can start painting within moments of sitting down and can pack away without damaging tools, paint or unfinished models. Everything in the box should have a fixed, visible place, so that a missing brush or an empty pot is noticed before a session starts rather than halfway through it.
The specifications below come from the observations, interviews and product analysis described above. Every essential criterion must be met for the design to be judged successful. The desirable criteria would make the box better to own and use, and will be included where the budget and timeline allow.
Essential criteria
Desirable criteria
The box must be made in the school workshop from materials already in stock, which are 6 mm birch plywood, 3 mm MDF and 3 mm clear acrylic. Every flat part must be cut on the laser cutter, so no single piece can be larger than its 600 × 400 mm bed. Materials for one box must cost no more than £25, and any finish must be water based so that the box can be used indoors as soon as it is dry. All edges and corners must be rounded or sanded smooth to meet the workshop's safety rules.
The project runs for ten weeks. Research and this brief will be complete by the end of week 2, and a card model of the internal layout will be tested with club members in week 3. Laser cutter time is shared with two other classes and must be booked two weeks in advance, so the first plywood prototype will be drawn by week 4 and cut in week 6. User testing against criteria E1 to E7 takes place in week 7, the final box will be finished in week 9, and the evaluation is due at the end of week 10.
Two details in this brief are worth copying. Each essential criterion can be checked with a test or a measurement, and each one traces back to something the research found, which is what makes the user testing in week 7 possible. The last paragraph also shows that the five elements do not always sit in separate sections: the laser cutter booking rule is a constraint, but it is the reason the timeline is arranged the way it is.
Students must be able toApply ideation techniques to develop a range of diverse and appropriate ideas that address a problem statement and respond to design specifications.
The Ideation phase asks designers to generate as many diverse, creative solutions as possible before evaluating any of them. Several structured tools help prevent mental blocks:
Substitute
What could be used in place of a part, material or process?
Replace the aluminium poles with inflatable air beams built into the seams of the tent. It is pitched with a hand pump in a few minutes, and there are no poles to lose, snap or thread through sleeves in the dark.
Combine
What could be merged with this product, or with one of its parts?
Combine the tent with the roof rack of a car. A rooftop tent folds out of a hard case fixed to the roof, which keeps campers off wet or rocky ground and lets them sleep wherever the car can be parked legally.
Adjust
What idea could be borrowed from another product and adjusted to suit this one?
Borrow the folding mechanism of an umbrella. A central hub at the top of the tent locks every pole into place when it is pushed up, so the whole frame opens in one movement instead of being assembled pole by pole.
Magnify / Minify
What could be made bigger, smaller, stronger or lighter?
Minify the packed tent until it fits inside a bicycle frame bag. Thinner fabric, shorter pole sections and a single door bring the weight under one kilogram, which makes it practical for cyclists who carry everything on the bike.
Put to other uses
Where else could this product, or part of it, be useful?
Pitch the fly sheet and poles without the inner tent to make a sun shelter for the beach. The parts that keep the rain off at night give shade during the day, so one purchase covers two uses.
Eliminate
What could be removed or simplified without losing the function?
Eliminate the guy ropes and pegs with a freestanding frame that holds its own shape. The tent can then stand on rock, sand or a wooden platform, where pegs will not go in.
Reverse / Reorder
What could be done in the opposite order, or turned the other way round?
Reverse the usual pitching order so that the waterproof fly sheet goes up first and the inner tent clips in underneath it afterwards. In heavy rain the sleeping area stays dry, because it is never exposed while the tent is being put up.
Here a design team reviews the first plywood prototype of the hobby box from 2.1.9, one hat at a time.
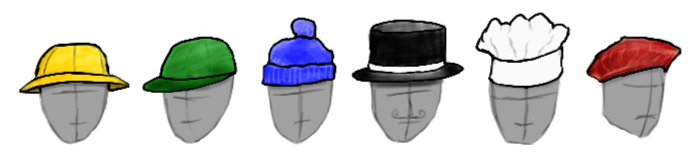
Yellow hat: Benefits and optimism
What works, and why is it worth doing?
Every brush and half-painted model came home undamaged, which none of the shoeboxes ever managed.
Green hat: Creativity and alternatives
What new ideas or alternatives could we try?
What if the lid flipped over and became the wet palette, so the box needs one less part?
Blue hat: Managing the thinking
What should we think about next, and what have we decided?
We have heard the risks. Let’s spend ten minutes on green hat ideas for the hinge, then agree the changes before user testing in week 7.
Black hat: Caution and risks
What could go wrong, and why might this fail?
The hinge screws are already pulling out of the 6 mm plywood. They will not survive a term of being opened every week.
White hat: Facts and information
What do we know, and what do we still need to find out?
Fully loaded, the prototype weighs 2.6 kg and holds 32 pots. Opening it took 75 seconds, which misses the 60-second target, and nobody has tested it on its side yet.
Red hat: Feelings and intuition
How do I feel about it, without needing to explain why?
It feels clunky to open, but I love the look of the birch, and I’d be proud to carry it into club.
The problem
In the classic glass bottle, ketchup refuses to move and then arrives all at once. People shake it, bang the bottom and end up with a puddle on the plate, and leaving the bottle upside down to help it along only makes it leak.
The contradiction
Making the ketchup come out more easily makes the bottle messier, because an opening that lets ketchup flow freely also lets it drip, leak and splatter. The old compromise was a narrow glass neck that kept things tidy but was painfully slow.
The principles
Four of the 40 inventive principles each remove part of the contradiction.
| Principle | What it says | What changed in the bottle |
|---|---|---|
| 13 The other way round | Turn the object or the process upside down. | The bottle is stored cap-down, so the ketchup is always waiting at the opening. |
| 30 Flexible shells and thin films | Replace a rigid structure with a flexible one. | Squeezable plastic replaces glass, so the user controls the flow by hand. |
| 15 Dynamics | Let a part change to suit the conditions it is in. | A silicone slit valve opens only when the bottle is squeezed and snaps shut when it is released, so a cap-down bottle does not leak. |
| 1 Segmentation | Divide an object into independent parts. | Single-portion sachets and dip pots give takeaway customers exactly as much as they need. |
The result
The modern bottle pours easily and stays clean. Nobody had to choose between the two requirements, because the contradiction itself was designed away.
The full set runs to 40. A few more, each with an everyday product that uses it:
Taking out
Separate the part that causes the problem from the rest.
The noisy compressor of an air conditioner sits outside the building.
Merging
Combine related operations so that they happen together.
A combine harvester cuts, threshes and cleans grain in a single pass.
Nested doll
Place one object inside another.
Telescopic walking poles slide into themselves to pack down small.
Beforehand cushioning
Prepare an emergency measure in advance.
Airbags wait folded inside the steering wheel until a crash.
Another dimension
Move into a new direction, such as stacking upwards.
Bunk beds fit two sleepers into the floor space of one.
Blessing in disguise
Use a harmful factor to get a useful effect.
Waste heat from a data centre is piped into nearby homes.
Cheap short-living objects
Replace one expensive, durable object with cheap ones.
A craft knife has snap-off blades, so a dull tip is broken off instead of sharpened.
Colour changes
Change the colour of an object to show its condition.
A baby spoon changes colour when the food is too hot.
Meets (2) Partly meets (1) Does not meet (0)
| Sandwich | Has pickles | Is spicy | Soft bread | Has crunch | Eaten one-handed | Survives a lunchbox | Score |
|---|---|---|---|---|---|---|---|
| Classic cheeseburger | Meets | Does not meet | Meets | Partly meets | Meets | Does not meet | 7 / 12 |
| Nashville hot chicken | Meets | Meets | Meets | Meets | Partly meets | Does not meet | 9 / 12 |
| Bánh mì | Meets | Meets | Partly meets | Meets | Meets | Partly meets | 10 / 12 |
| Roujiamo | Does not meet | Partly meets | Partly meets | Partly meets | Meets | Partly meets | 6 / 12 |
| Grilled cheese | Does not meet | Does not meet | Partly meets | Meets | Meets | Does not meet | 5 / 12 |
| PB&J | Does not meet | Does not meet | Meets | Does not meet | Meets | Meets | 6 / 12 |
| KFC Double Down | Does not meet | Does not meet | Does not meet | Meets | Partly meets | Does not meet | 3 / 12 |
No sandwich meets every criterion. The bánh mì scores highest, which makes it the strongest starting point: a designer would keep what already works and look for a softer roll and a filling that holds up in a lunchbox.
Students must be able toCompare their ideas with the design specifications and user needs as they refine their solutions.
Iterative evaluation means systematically comparing each design idea against the design specifications and user needs, not once, but repeatedly as ideas evolve. At each stage, designers ask:
Design matrices (decision matrices) formalise this process: specifications are listed as rows, ideas as columns, and each cell receives a weighted score. The matrix makes trade-offs visible and defensible against stakeholder challenge.
Iterative evaluation drives targeted refinement: weak areas are identified with enough precision that the next iteration can address them specifically. This is far more efficient than building a complete prototype and discovering at that point that a fundamental specification has not been met.
Students must be able toDemonstrate iterative development of a design using the model, test, refine cycle.
The model–test–refine cycle is the engine of the Design a Solution phase. Rather than developing a finished product in a single pass, designers move through repeated loops:
This maps onto the PDSA (Plan-Do-Study-Act) cycle from quality management: Plan what to test and how; Do by building and running the test; Study what the data shows; Act by implementing changes before the next cycle.
Stakeholder feedback (from clients, users and technical experts) is incorporated at every cycle. Each iteration reduces uncertainty. A product that has been through five test–refine cycles is far better aligned with real user needs than one developed in a single extended phase.
Students must be able toCreate feasible models of an intended solution at appropriate levels of fidelity that generate performance data when tested with end-users.
A prototype is a physical or virtual model built to test a specific aspect of a design before committing to full production. Prototypes are categorised by fidelity: how closely they resemble the final product.
Low-fidelity (lo-fi) prototypes:
High-fidelity (hi-fi) prototypes:
The sequence is always lo-fi to hi-fi: only invest in expensive prototyping once a concept has survived lo-fi testing. Every prototype exists to generate test data that feeds the next iteration.
Students must be able toCreate detailed drawings of components and assembled products that communicate dimensions, scale and assembly details.
Technical drawings (also called engineering or working drawings) are the formal language of manufacturing: they convey exact dimensions, tolerances, materials, scale and assembly instructions to manufacturers anywhere in the world.
Key conventions include:
Without accurate technical drawings, the gap between a prototype and a manufactured product cannot be closed. Every dimension becomes a specification that manufacturing must achieve.
Students must be able toCreate virtual representations of a solution, highlighting key usability features, and explain how it meets the design specifications and achieves the design intentions as a proposed solution or as an improvement to an existing product.
The Present a Solution phase is the designer's opportunity to communicate the full value of their work to clients, stakeholders and users. An effective presentation goes beyond "here is what it looks like"; it tells the story of the design: the user problem, the research journey, the key design decisions, and the evidence that the solution meets its specifications.
Tools for presenting solutions include:
An effective presentation clearly states the user need being addressed, shows how key features directly respond to specific design specifications, and acknowledges limitations with a plan for future refinement. The goal is not to sell the design but to demonstrate that it is evidence-based and can withstand scrutiny.
Ten questions sampling across the fifteen learning objectives, from the five-phase process and research through to specifications, ideation and technical communication. Select one answer per question, then click "Check all answers" to see your score and the explanations.
A secondary school canteen serves 900 students in a 40 minute lunch break. Complaints about queueing led the school to ask a design team to solve the problem. The brief it issued read: "Design a faster till system."
The team declined the brief as written and spent two days observing before redefining it.
Table 1: Time spent by a student between joining the queue and sitting down, mean of 120 observations
| Stage | Mean time |
|---|---|
| Queueing to reach the food counter | 9 min 10 s |
| Choosing and being served | 1 min 20 s |
| Queueing to reach the till | 3 min 05 s |
| Paying | 0 min 22 s |
| Finding a free seat | 4 min 40 s |
(a) State the research method used to produce the data in Table 1. [1]
(b) Outline why the school's original brief would not have solved the problem, see Table 1. [2]
(c) Explain why defining the problem correctly matters more to the outcome than the quality of the ideation that follows, see Table 1. [3]
(a) User observation, recording a user journey.
(b) Paying takes 22 seconds out of a total of over eighteen minutes, so even a till that worked instantly would return less than half a minute to the student. The delay is in the queue for the food counter at 9 min 10 s and in finding a seat at 4 min 40 s, and neither is touched by a faster till.
(c) A definition sets the boundary of everything that follows, so a team ideating brilliantly against "design a faster till" can only produce faster tills. The best possible outcome of the wrong problem is worse than a mediocre outcome of the right one, because the ceiling is fixed by the definition rather than by the ideas. The definition also decides what counts as success, and a team measuring itself on transaction time would report a triumph while students still queued for eighteen minutes. What the observation did was move the problem from the till to the flow of 900 people through one space, which opens solutions ideation could never have reached from the original wording, such as staggering the break, adding a second serving point or changing the seating. This is why the design process puts empathizing and defining before ideation: ideas are cheap to generate and cannot rescue a problem that was framed wrongly.
(a) • User observation ✓
• User journey mapping ✓
• Primary research ✓
Award [1] for the correct research method up to [1 max].
(b) The first step in solving a problem is to define it.
• Paying takes 22 s out of a total exceeding eighteen minutes ✓
• An instant till would return less than half a minute to the student ✓
• The largest delay is queueing for the food counter at 9 min 10 s ✓
• Finding a seat at 4 min 40 s is longer than the till queue and payment combined ✓
• Neither of the two largest delays is affected by the till ✓
• The brief named a solution rather than a problem, closing off the alternatives ✓
Award [1] for each relevant brief point on why the original brief would not have solved the problem up to [2 max]. Credit responses that quote values from Table 1.
(c) The design process is comprised of five sections, and defining the problem precedes ideation.
• The definition sets the boundary of every solution the team can reach ✓
• Ideating well against the wrong problem still only produces faster tills ✓
• The ceiling on the outcome is fixed by the definition, not by the quality of the ideas ✓
• The best outcome of a wrong definition is worse than a mediocre outcome of the right one ✓
• The definition also decides the success measure, so the team can report success while the problem persists ✓
• Reframing to the flow of 900 people through one space opens solutions the original wording excluded ✓
• Staggered breaks, a second serving point or changed seating are unreachable from "a faster till" ✓
• Ideas are cheap to generate, so ideation is rarely the constraint ✓
• A wrongly defined problem is only discovered after the solution is built and fails ✓
Award [1] for each relevant reason / cause explaining why problem definition matters more than the ideation that follows up to [3 max]. Credit responses that use Table 1 as evidence.
A hive tool is a flat steel bar used by beekeepers to prise apart hive boxes stuck together with propolis, and to scrape wax from frames. One end is a chisel, the other a hook. It is the tool a beekeeper picks up most often and the one most often lost in long grass.
A designer analysed three existing hive tools before writing a specification.
Table 2: Product analysis of three existing hive tools
| Tool A | Tool B | Tool C | |
|---|---|---|---|
| Material | Carbon steel, painted | Stainless steel | Stainless steel |
| Length | 250 mm | 178 mm | 280 mm |
| Mass | 180 g | 105 g | 240 g |
| Grip | Bare metal | Bare metal | Moulded polymer |
| Finish | Red paint, chips | Bright | Yellow polymer |
| Price | £6 | £9 | £22 |
(a) State one specification criterion that Table 2 shows tool B fails. [1]
(b) Describe how analysing three existing tools informs the specification for a new one, see Table 2. [2]
(c) Justify writing the specification criterion for visibility as a measurable requirement rather than as "should be easy to find". [3]
(a) Visibility when dropped in grass: tool B is bright bare steel with no colour.
(b) Comparing three tools separates the properties that vary from those that do not, so the designer can see that all three are steel bars with a chisel and a hook, which fixes the parts of the specification that are settled, while length ranges from 178 mm to 280 mm and price from £6 to £22, which are the decisions still open. The comparison also exposes the trade-offs already made by others: tool C buys grip and visibility with 240 g of mass and a price nearly four times tool A's, which tells the designer what a comfortable, findable tool has historically cost.
(c) A measurable criterion can be tested, and "easy to find" cannot. Someone has to decide whether the finished tool passes, and with a vague wording that decision is an opinion, so the designer, the manufacturer and the client can all disagree and none of them can be shown to be wrong. A measurable version, such as a fluorescent finish visible at ten metres in 100 mm grass, produces a test anyone can run and get the same answer to. It also carries information the vague version does not: it tells the designer that colour rather than shape is the mechanism, and it sets the distance and the conditions, which is what determines the hue and the size of the coloured area. Because it is quantified it can be used as the standard at the evaluation stage, so the tool can be judged against what was actually asked for rather than against what people remember wanting.
(a) • Visibility when dropped, being bright bare steel ✓
• Comfort in the hand, having a bare metal grip ✓
• Leverage, being the shortest at 178 mm ✓
• Corrosion resistance is met, so do not credit ✓
Award [1] for one criterion that Table 2 shows tool B fails up to [1 max]. The criterion must be supported by a value in Table 2.
(b) Product analysis is a tool used by designers to gain insight into the function, performance and features of an existing product.
• Comparison separates what is constant across products from what varies ✓
• All three are steel bars with a chisel and a hook, which fixes the settled parts of the specification ✓
• Length varies from 178 to 280 mm and price from £6 to £22, marking the open decisions ✓
• It reveals trade-offs already made: tool C buys grip and visibility with mass and price ✓
• It establishes a realistic range for each criterion rather than an arbitrary target ✓
• It shows where every existing product fails, which is where the opportunity lies ✓
• It gives a benchmark against which the new tool can later be evaluated ✓
Award [1] for each detail, leading to an account of how analysing existing products informs a specification, up to [2 max].
(c) Defining clear design specifications leads to clear parameters for the development of a solution.
• A measurable criterion can be tested; "easy to find" cannot ✓
• Someone must decide whether the finished tool passes, and a vague wording makes that an opinion ✓
• Designer, manufacturer and client can disagree with no way to resolve it ✓
• A measurable version gives a test that anyone can run and get the same answer to ✓
• Quantifying it names the mechanism, colour rather than shape ✓
• Stating the distance and conditions determines the hue and the coloured area ✓
• It becomes the standard at the evaluation stage of the design process ✓
• The product is judged against what was asked for rather than what people remember wanting ✓
• A vague criterion is always met, so it exerts no pressure on the design ✓
Award [1] for each valid reason / piece of evidence supporting a measurable criterion up to [3 max]. Award a maximum of [2] where the response does not refer to testing or evaluation.
A city operates a docked bike-share scheme. Bikes lock into a steel dock at a station, and a rider releases one by tapping a card. Stations sit on pavements and are installed without excavation, bolted to the surface.
The operator is redesigning the dock. Its first activity was research.
(a) Identify two examples of secondary research that would inform the redesign of the bike-share dock. [2]
Observation at twelve stations produced the journey map below.
Table 3: Observed user journey, releasing a bike
| Step | Observed |
|---|---|
| Approach station | Riders walk the row looking for a bike with an inflated front tyre |
| Tap card | Reader position varies along the row; 1 in 5 taps the wrong dock |
| Wait for release | Green light is on the dock, at ankle height, hard to see in sun |
| Pull bike out | Requires a firm backward pull; some riders assume it has not released |
| Leave | Riders with a released bike sometimes take a different one |
(b) Outline the design opportunity revealed by riders walking the row before tapping, see Table 3. [2]
Two concepts were modelled in card at full size and stood in a corridor for staff to try. Concept 1 moved the reader to a single column at the end of the row. Concept 2 kept a reader on every dock but raised it to waist height.
(c) Describe why the two reader positions were tested as full-size card models rather than as CAD renderings. [2]
The operator's manager proposes skipping the modelling stage on future projects, arguing that the team has now learned what works and can go straight from research to a manufactured dock.
(d) Explain why the iterative model-test-refine cycle should be retained, see Table 3. [4]
(a) Published accessibility standards for street furniture, and the operator's own maintenance records showing which dock components fail most often.
(b) Riders are inspecting tyres because they cannot trust that a docked bike is serviceable, which means the dock is failing at a job nobody specified for it: reporting the condition of the bike it holds. The opportunity is to move that check from the rider to the dock, since a dock already holding the bike could sense or display its state and let the rider walk to a bike already known to be sound.
(c) The questions at this stage are about height, reach and where a person's eye goes, and those can only be answered by a person standing in front of a full-size object. A rendering is viewed on a screen at whatever size the screen is, so it cannot tell the team whether a reader at waist height is actually within comfortable reach or whether the light is visible from where a rider stands. Card is also fast and obviously unfinished, so staff will criticise it freely and the team can cut and re-tape a change between one tester and the next.
(d) The argument assumes the team's learning transfers to the next problem, and Table 3 is a record of why it does not.
Almost every problem in that table is one nobody predicted. That a fifth of riders tap the wrong dock, that a green light at ankle height is invisible in sun, that a firm pull reads as a failure to release: these were found by watching people, not by reasoning about the design. A team that had gone straight to manufacture would have built all of them, and each is now cast in bolted steel across an entire city. The specific lesson the team has learned is that its predictions were wrong, which is an argument for more testing rather than less.
The cost asymmetry is severe here. A card model costs an afternoon; a dock is a steel product installed at scale on public pavements, so a fault discovered after manufacture is multiplied by every station and can only be corrected by a second installation programme. Testing early is cheap precisely because nothing has been committed.
Iteration also does something a single pass cannot, which is to surface the problems that only appear once the first ones are fixed. Raising the reader to waist height will change where riders stand, and where they stand changes what they can see and reach, so the next round of testing asks questions that did not exist before the change was made. Concepts 1 and 2 are not two guesses to choose between, they are two probes whose results feed the next version.
Finally, each cycle produces evidence. When the operator asks why the reader moved, the team can point to a tested comparison rather than to its own judgment, which is what lets a design decision survive scrutiny.
(a) Secondary research involves the collection of data provided by a third party and is used to support or validate primary research.
• Published accessibility standards for street furniture ✓
• The operator's own maintenance and fault records ✓
• Anthropometric data tables for reach and eye height ✓
• Competitor dock designs in other cities ✓
• Patent literature on docking mechanisms ✓
• Local authority pavement and installation regulations ✓
• Published ridership and journey data ✓
Award [1] for each relevant example of secondary research up to [2 max]. Do not credit observation, interviews or surveys, which are primary research.
(b) Designers engage in user observation, mapping the user's journey as they carry out a task, in order to identify design opportunities.
• Riders cannot trust that a docked bike is serviceable ✓
• They perform a manual inspection the system never asked them to perform ✓
• The dock is failing at an unspecified job, reporting the condition of the bike it holds ✓
• The dock already holds the bike, so it is the natural place to sense or display its state ✓
• Moving the check to the dock lets the rider walk straight to a sound bike ✓
• It would also tell the operator which bikes need maintenance without a site visit ✓
• The walk along the row is wasted time that the redesign can remove ✓
Award [1] for each relevant brief point on the opportunity revealed up to [2 max]. Award a maximum of [1] where the response restates the observation without identifying an opportunity.
(c) The ideation and modelling stage involves developing distinct ways to solve a problem, using models appropriate to the question being asked.
• The questions concern height, reach and sightline, which need a full-size object ✓
• A rendering is viewed at screen size, so it cannot test reach or comfortable operating height ✓
• A tester must stand where a rider stands to judge whether the light is visible ✓
• Card is fast, so a change can be made between one tester and the next ✓
• An obviously unfinished model invites criticism that a polished rendering suppresses ✓
• Full size reveals the relationship between the dock, the bike and the person ✓
• Cost is low enough that both concepts can be built and compared ✓
Award [1] for each detail, leading to an account of why full-size card models suited this stage, up to [2 max]. Credit responses referring to tangibility or to the speed of change.
(d) The design process is iterative: solutions are modelled, tested and refined rather than produced in a single pass.
The team's learning does not transfer:
• Almost every problem in Table 3 was unpredicted and found by observation ✓
• The wrong-dock taps, the ankle-height light and the firm pull were not reasoned out in advance ✓
• The lesson learned is that the team's predictions were wrong, which argues for more testing ✓
• A new project has a new context, so previous findings do not carry over unchanged ✓
Cost asymmetry:
• A card model costs an afternoon; a dock is steel, installed at scale on public pavement ✓
• A fault after manufacture is multiplied by every station in the city ✓
• Correction requires a second installation programme, not a repair ✓
• Testing is cheap precisely because nothing has been committed ✓
Iteration surfaces new problems:
• Fixing one problem changes the interaction and creates questions that did not exist before ✓
• Raising the reader changes where riders stand, which changes what they can see and reach ✓
• Concepts 1 and 2 are probes whose results feed the next version, not a final choice ✓
Evidence:
• Each cycle produces a tested comparison rather than an assertion of judgment ✓
• Evidence is what lets a design decision survive scrutiny from the client ✓
Award [1] for each relevant detail / reason / cause supporting retention of the iterative cycle up to [4 max]. Award a maximum of [3] where the response argues only from cost. Credit responses that use Table 3 as evidence.
Linking Questions
In the late 1990s, the PC was becoming the go-to machine for 'serious' gamers. The Sony Playstation and Nintendo 64 consoles were showing their age, compared to rapid advancements seen on desktop computers. Games like Half-Life, Age of Empires 2, Starcraft, Unreal, and Quake 3 featured cutting-edge graphics, online multiplayer, and community mods- all of which simply could not be had on consoles at the time. The tradeoff was more expensive hardware, troubleshooting, and a total lack of 'plug and play' simplicity that the consoles possessed. You could just pop in a game cartridge or disc and start playing! Microsoft was keenly aware of the growth in gaming on their operating systems, and set out to explore the potential of developing a console.
Through task analysis, interviews, and user observations, the team noted critical friction points. Gamers hated long loading screens that broke immersion. Online play was a fragmented mess, and they desperately wanted a unified "friends list" rather than managing separate accounts for every game. The PC was also isolating, and prevented the 'local multiplayer' experience that players could find with the Nintento 64 and games like Mario Kart and Super Smash Brothers.
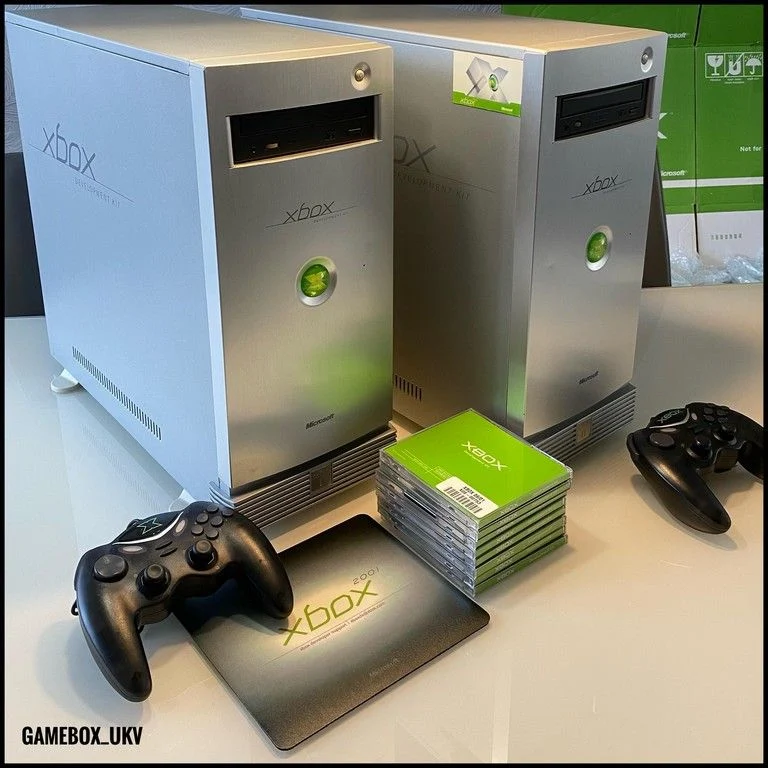
Microsoft's response to Sony split into two rival proposals fighting for the same budget and the same slot on the roadmap. One team pitched a cheap, Windows CE machine built from the company's existing WebTV division, positioned as a general "convergence device" for internet and video as much as games. The other pitched something closer to a stripped-down gaming PC: DirectX-compatible, aimed squarely at hardcore gamers aged 16 to 26, and priced high enough to justify real performance. Both teams pitched Bill Gates directly, in the same room, more than once.
The gaming-PC team nearly lost on cost alone. Their first budget estimate was so rough it forgot to include the price of the screws. What tipped the decision their way was credibility with developers, built in part on outside advisers like Tim Sweeney and John Carmack, and a genuinely difficult spec fight over whether to include a hard drive. No competing console had one, and it added real cost. Games chief Ed Fries pushed hard anyway, arguing it would enable online play, faster loading, and saved games without a fiddly memory card. Gates was convinced, and the hard drive became one of the console's defining features.
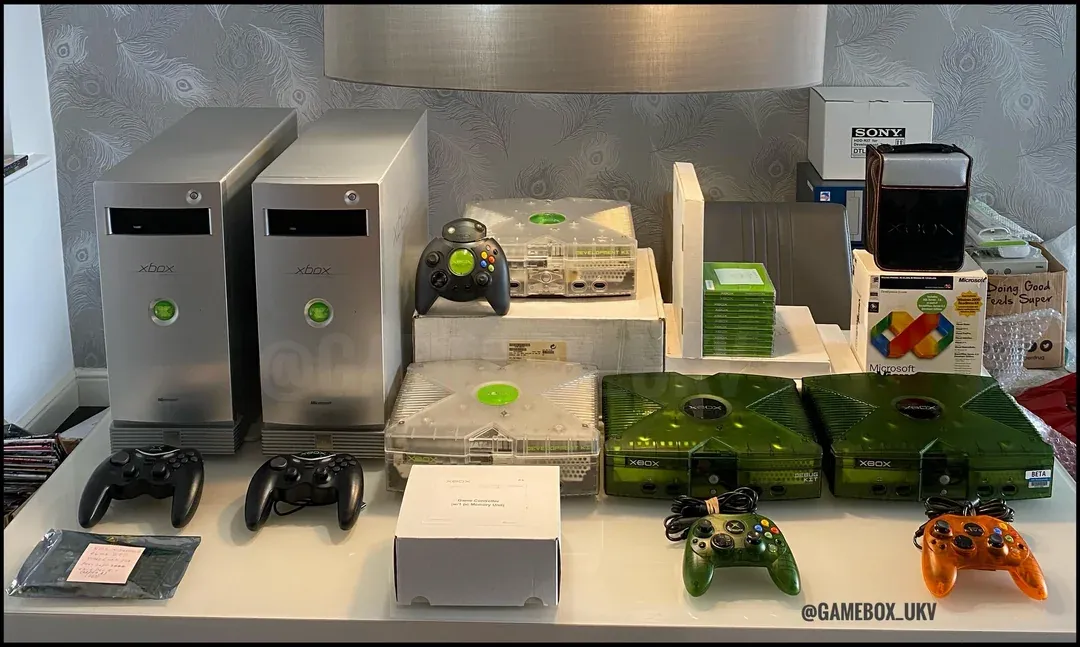
Once the console had real backing, industrial designer Horace Luke, fresh from a stint at Nike, took his team out of the building. Rather than sketching from assumptions, they visited people's homes to watch how consoles were actually used. Two small observations reshaped the design: gamers instinctively left drink cans balanced on top of their consoles, so Luke removed the vents from the top of the case entirely and routed airflow elsewhere to keep spilled soda out of the electronics. Cables were always too short, dragging consoles onto the floor, so the team lengthened the controller cord to nine feet and added a breakaway connector so a tripped cable wouldn't pull the console down with it.
Colour and branding went through their own long cycle of iteration. Green was chosen partly because every rival, Sony, Nintendo, and Sega, had avoided it, and partly for its old association with "technology," dating back to the green phosphor of early computer monitors. The team actually preferred silver, but it was too expensive to manufacture at scale, so it survived only on the reveal prototype. The logo went through 40 to 50 rounds with an outside studio, Cinco Design, alongside a written brand story; an early cube-shaped concept was scrapped the moment Nintendo announced its own console would be called the GameCube.
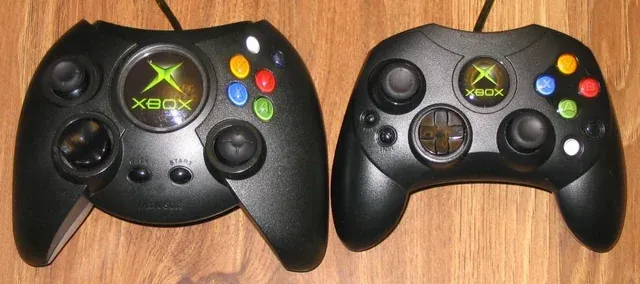
Turning the concept into a shippable object meant constant negotiation between what looked good and what a factory could build at the right price. A perfectly centred DVD tray looked cleaner on paper, but airflow needs pushed it off to one side instead. A two-tone case was dropped late in development because it added roughly a dollar to every unit, real money once you're building millions of consoles. The hard drive and DVD drive couldn't sit too close to each other either, both for heat and because a dropped console could let one damage the other, and the finished case still had to be small enough to fit a media cabinet built for a VCR.
The controller, nicknamed "Duke" inside Microsoft, was sized for the hands of the player the team had defined from the start: males in their late teens and twenties. It suited that group well, but not everyone, a gap only properly addressed after launch (a story picked up in A1.1 Ergonomics, with the smaller controller built for the Japanese market). Inside the case sat a custom Nvidia graphics chip and a desktop-grade Intel processor, both squeezed into a shell no larger than the consoles already sitting in people's living rooms.
The reveal happened in two very different rooms. In March 2000, Bill Gates and Seamus Blackley stood on stage at the Game Developers Conference in San Jose and showed developers what was inside the machine: its DirectX lineage, its Nvidia graphics silicon, and the promise of one fixed hardware spec instead of the sprawling mess of configurations they had to support on PC. That was the pitch aimed at the people who would actually build the games.
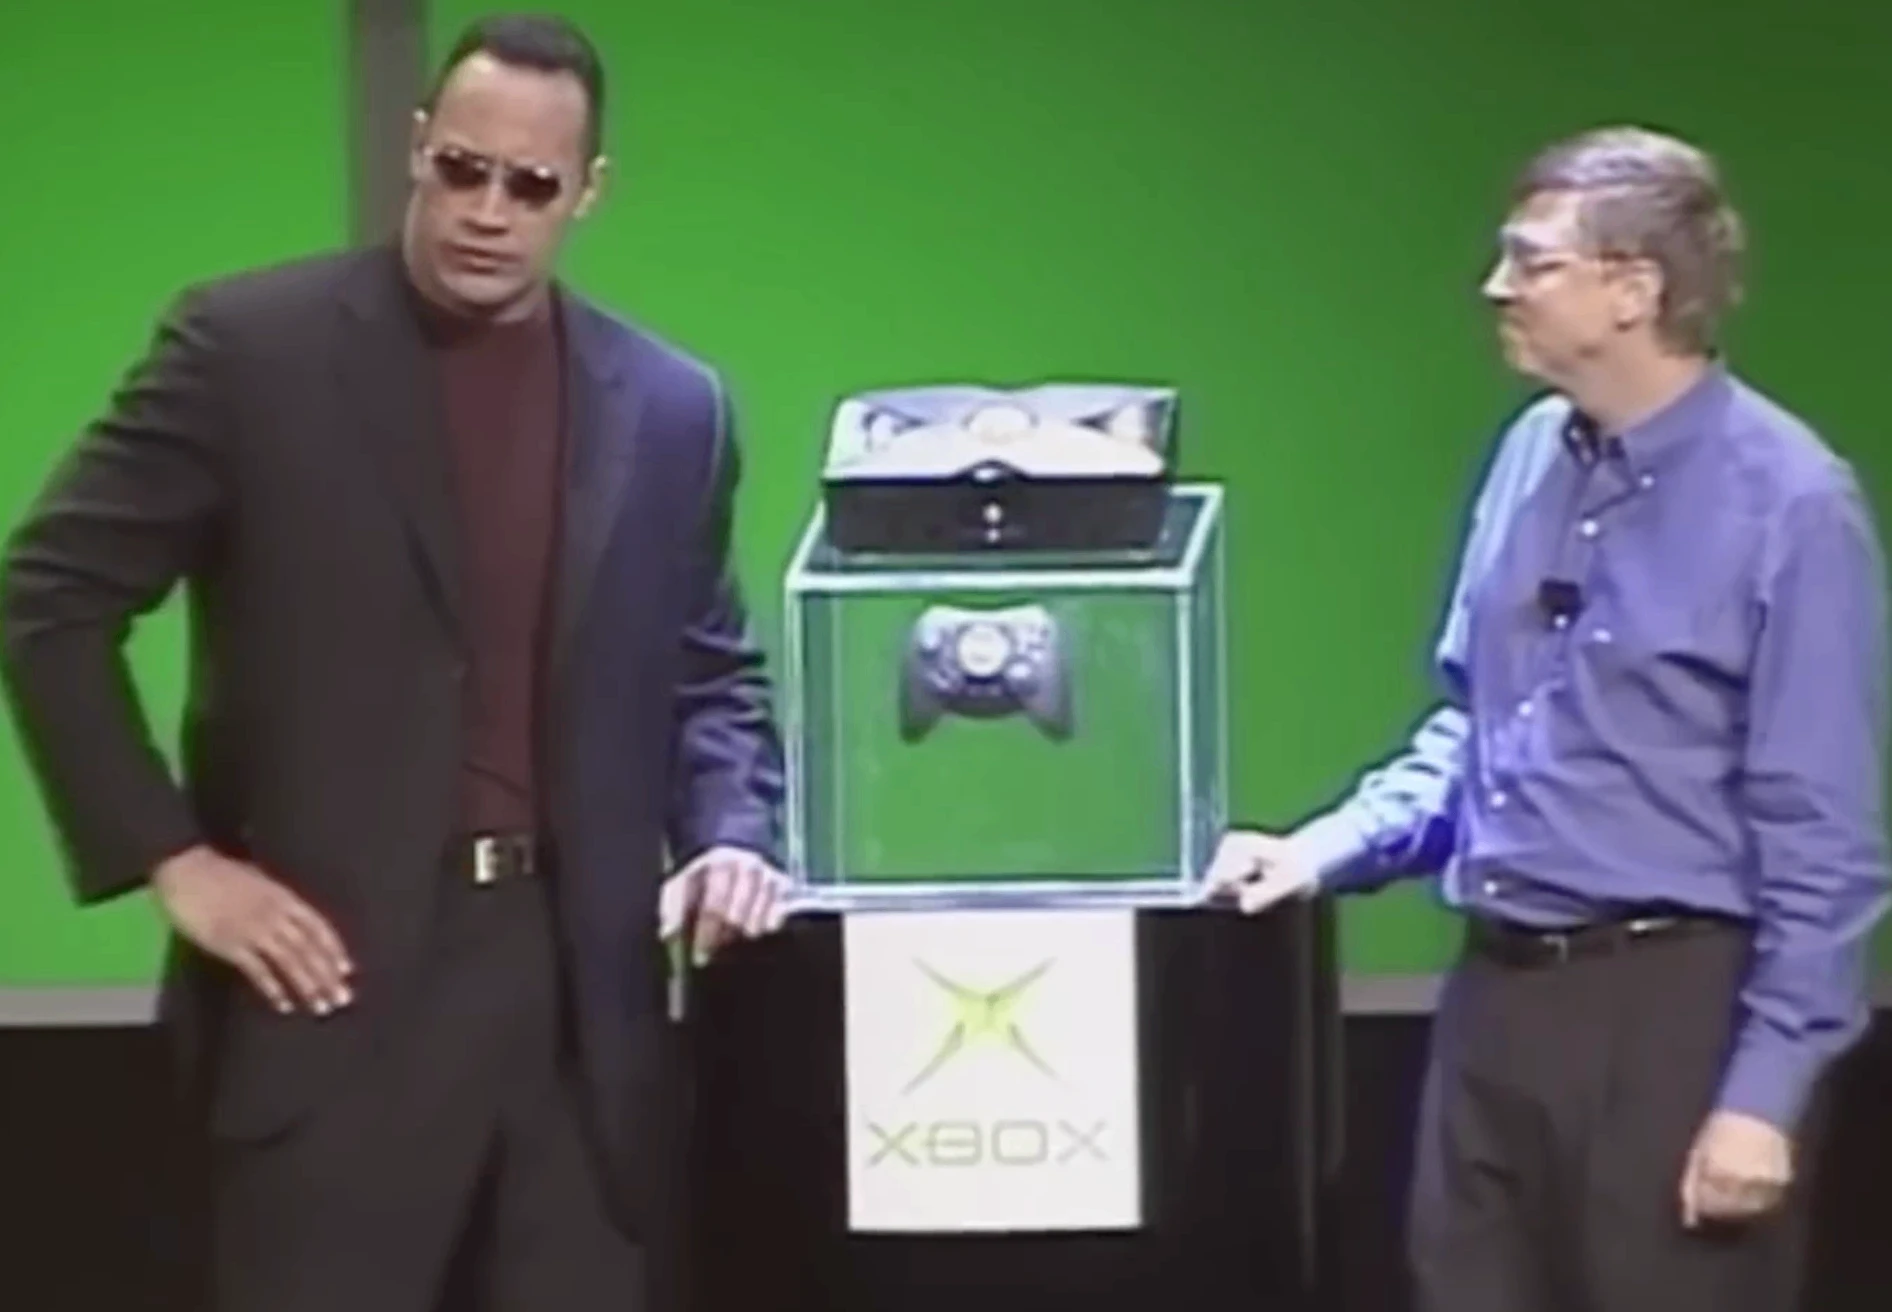
Consumers got their own reveal ten months later, when Gates shared the CES 2001 stage with wrestler Dwayne "The Rock" Johnson to show off the console for the first time. Alongside it, Microsoft revealed the business model behind the hardware: rather than profit from the console itself, they would sell it near cost and recover the margin through developer royalties of about $7 per game, the same razor-and-blades approach Sony and Nintendo already used. The tagline said the rest: "Built by gamers, for gamers."
Learn more about the original Xbox, development, and games. (Wikipedia)
Watch the cringeworthy Bill Gates and Dwayne 'The Rock' Johnson presentation here. (Youtube)
The hard drive is the clearest evidence that Xbox's design process wasn't a straight line. Cost pressure nearly cut it entirely, since no rival console shipped with one and it wasn't cheap to include. Games chief Ed Fries forced the team back into the Define phase anyway, arguing that always-on storage would let players jump into online matches, cut load times, and save games without fumbling for a memory card. Gates agreed, and the hard drive went from a maybe to a locked specification.
The loop didn't stop at launch either. Once the console reached Japan, it became clear the "Duke" controller, sized around Microsoft's core North American demographic, didn't fit everyone. That story, and the smaller controller it produced, belongs to A1.1 Ergonomics rather than here, since the fix came well after Xbox had already shipped.
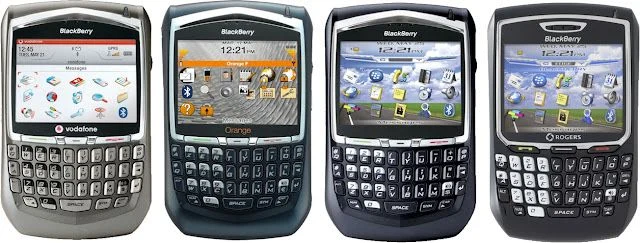
Apple's design team, led by Jony Ive, spent hundreds of hours conducting ethnographic studies watching people interact with their mobile devices. They noticed a recurring pattern of frustration: users constantly misplaced their styluses, text entry on tiny plastic keyboards was error-prone, and the mobile internet was a stripped-down, text-only ghost of the real web.
Designers mapped out "thumb reach zones" on physical devices, realizing that mobile interaction shouldn't force the human hand to adapt to rigid plastic buttons; the device should adapt to the hand.
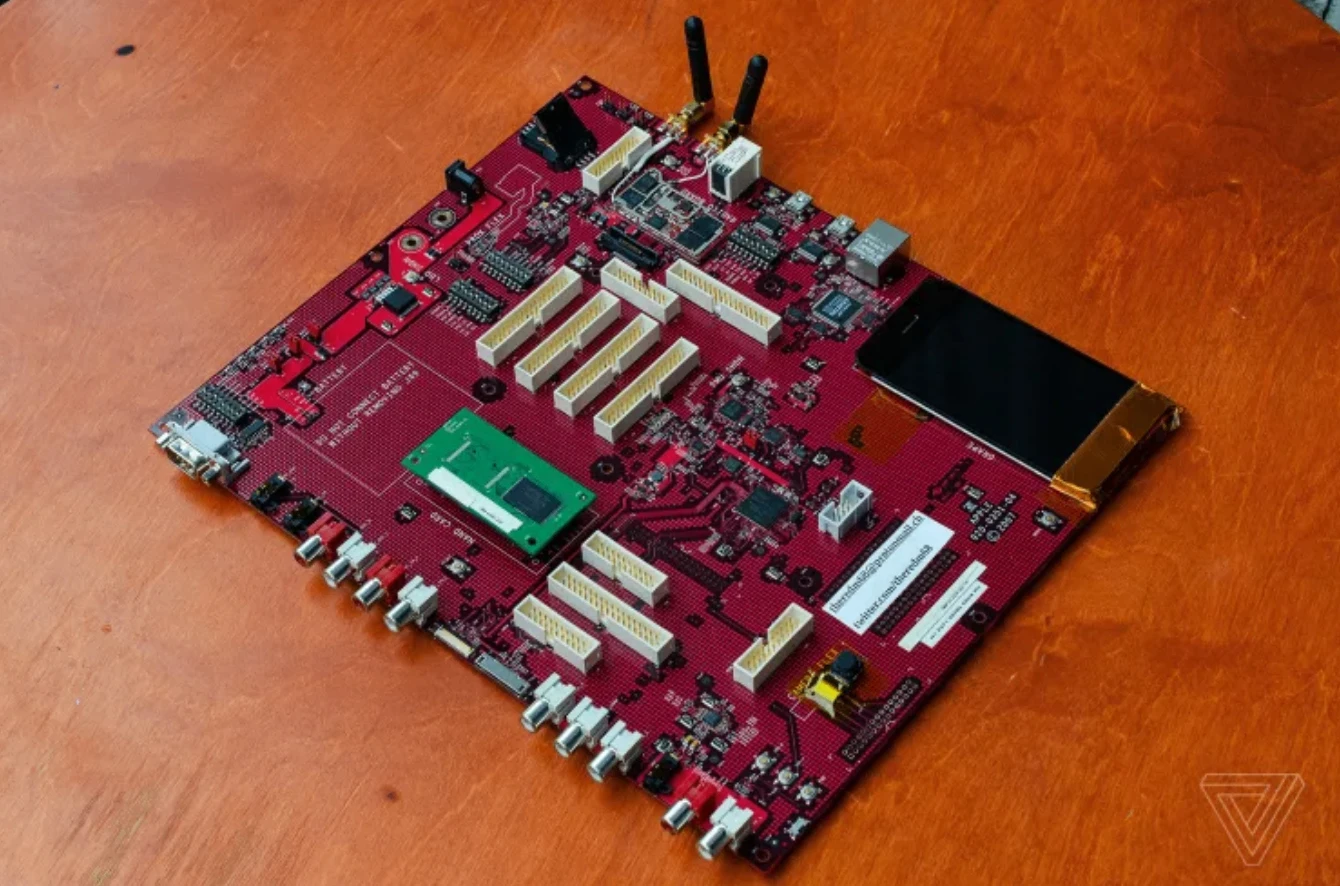
The design brief was distilled by Steve Jobs into a historic, three-pronged problem statement: Design a widescreen iPod with touch controls, a revolutionary mobile phone, and a breakthrough internet communications device: all integrated into a single, seamless product.
The constraints were uncompromising: No physical keyboard. No stylus. The user's finger would be the primary input tool. The minimum product specifications required a massive 3.5-inch capacitive screen, multi-touch gestures, and a fully functional desktop-class operating system (OS X) scaled down for a pocket device.
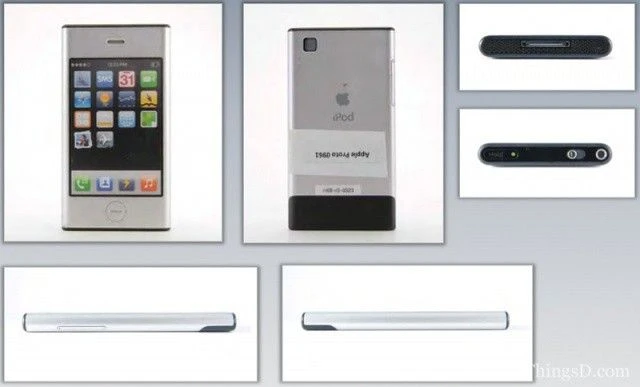
The ideation phase was incredibly chaotic, generating over 200 distinct physical and digital prototypes. Apple split into two competing design tracks. One track, codenamed P1, tried to adapt the existing iPod click-wheel into a phone dialer (which failed miserably during user testing).
The second track, P2, experimented with experimental multi-touch glass panels. Designers built giant, iPad-sized plastic slabs bolted to workbenches, wired to external computer towers, just to simulate what scrolling through a list with a finger might feel like. They even used dummy plastic blocks with taped-over screens to test weight, thickness, and pocketability without revealing the software.
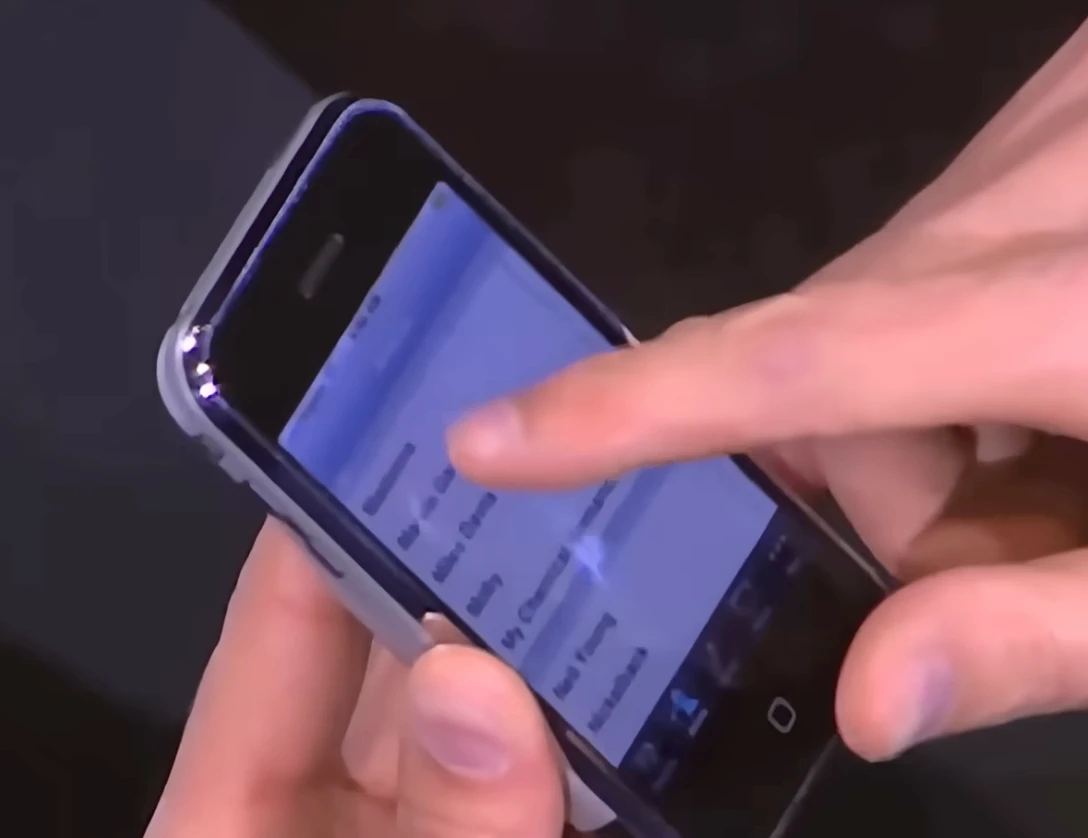
Developing the iPhone required massive breakthroughs in material science and user interface testing. Originally, the screen was meant to be heavy-duty plastic. However, after Steve Jobs carried a prototype in his pocket for a few weeks, he realized keys easily scratched the surface. The design team looped back to source an entirely unreleased material from Corning: Gorilla Glass.
Engineers ran over 100 UI tests just to perfect the "rubber-band scrolling" effect (where a list bounces when it hits the bottom), ensuring the software felt physically responsive. Hardware designers redesigned the internal steel band (which doubled as the device's antenna) five times to maintain structural integrity while ensuring cellular reception.
On January 9, 2007, the iPhone was presented to the world in what is widely considered the most successful product keynote in history. To convince a skeptical public used to physical keyboards, the presentation focused heavily on user interface feedback mechanisms.
The live demo highlighted the intuitive "slide to unlock" animation and the magical "pinch-to-zoom" gesture. Technical documentation released alongside the launch illustrated the highly complex layered construction of the display: an LCD screen, a digitizer grid, and a capacitive touch sensor stack working in perfect harmony.
Watch Steve Jobs predict the future when introducing the world to the iPhone. (Youtube)
Learn more about the iPhone's development and hardware. (Wikipedia)
The iPhone's development was a masterclass in design agility. Just two months before the official launch, the team realized that the plastic screen formulation was fundamentally flawed for daily use, forcing a sudden loop from the Design a Solution phase back to Material Specifications. Furthermore, early testing with users who had larger fingers revealed high error rates on digital keys, forcing designers to loop back, re-empathize, and rewrite the software algorithms to create a dynamic "invisible" 44-point touch target area that anticipated which letter the user intended to hit next.
Masaru Ibuka closely observed the daily habits of urban commuters and teenagers. He noticed business executives carrying heavy, briefcase-sized tape recorders just to listen to audio on trains. Even more fascinatingly, he observed that young people were misusing existing technology: they would press the "record" button on heavy portable dictation machines just to use them as playback devices, completely ignoring the microphone.
The deep user insight was clear: there was a massive, unaddressed emotional and functional need for private audio spaces in crowded, public environments.
The design brief was highly restrictive and completely flipped the audio industry on its head: Design a stereo cassette playback device under 500 grams that runs on standard AA batteries and can comfortably fit into a coat pocket.
Crucially, the engineering team made a radical choice during the definition phase: remove the recording function entirely. In 1979, an audio device that couldn't record was seen as commercial suicide, but the team defined the lack of a microphone as a feature, not a bug, to keep the device compact, lightweight, and entirely focused on high-quality playback.
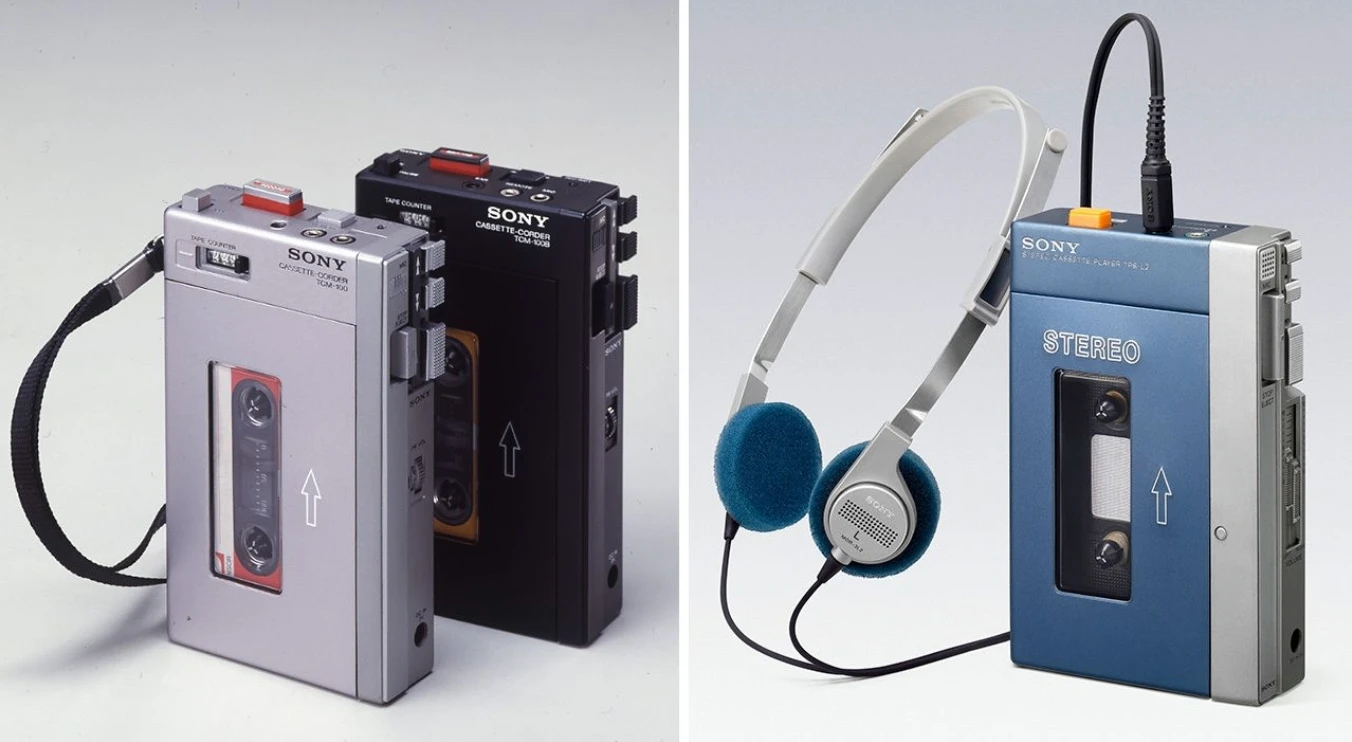
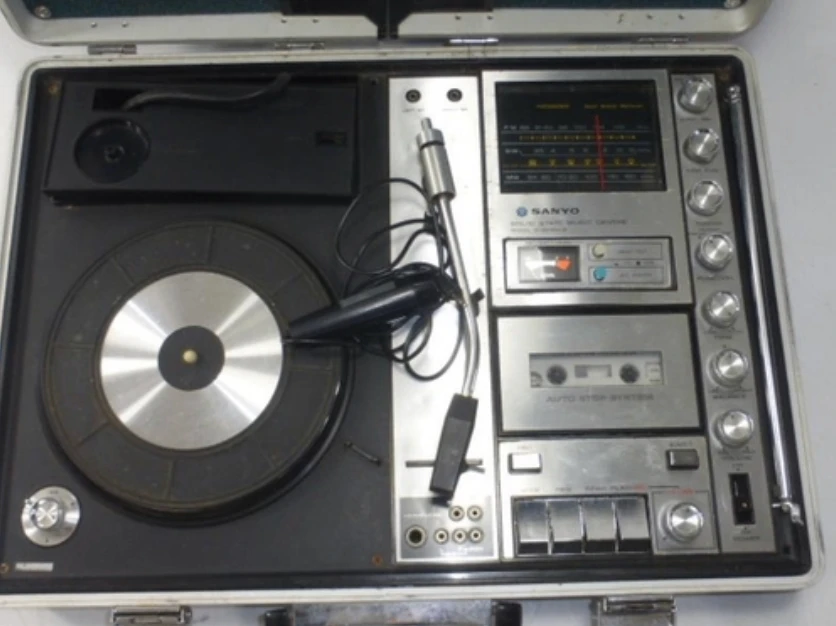
To move quickly, the engineering team bypassed building a prototype from scratch. Instead, they used a donor device: the Sony Pressman, a rugged, mono dictation recorder built for journalists.
Engineers hacked the Pressman by ripping out the internal speaker and recording head, replacing them with a custom-engineered stereo amplifier circuit. They built crude physical models using lightweight foam padding and fake leather straps to test how comfortably the device could be worn on a user's hip or shoulder. As a last-minute ideation breakthrough to promote sharing, they added a second headphone jack so two people could listen at once.
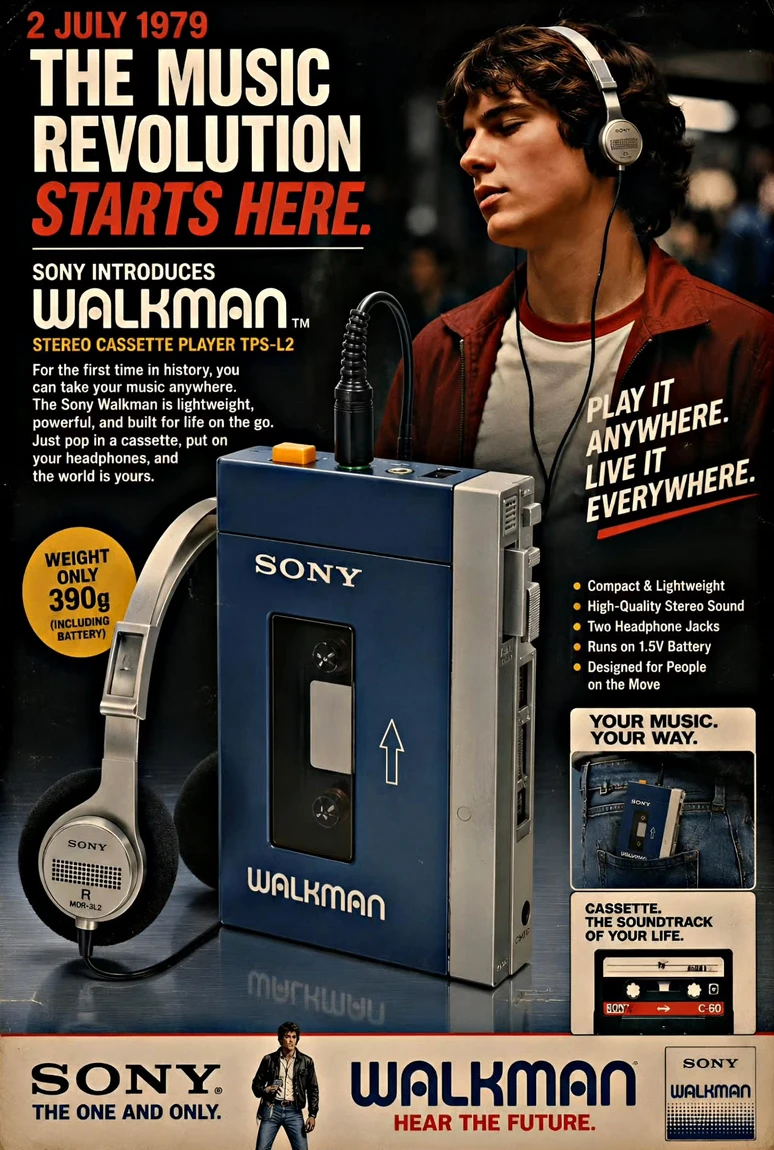
Translating the hacked prototype into a consumer product meant overcoming intense engineering constraints. Traditional headphones of the era were massive, heavy, and weighed more than the Walkman itself. Sony had to concurrently design a new lightweight headphone line (weighing just 50 grams).
To maximize battery life, engineers meticulously adjusted the internal electrical impedance of the system from 8Ω to 16Ω. They also re-engineered the main housing, moving from the heavy machined metal of the Pressman prototype to a high-impact ABS plastic chassis, which drastically lowered manufacturing costs and overall product weight.
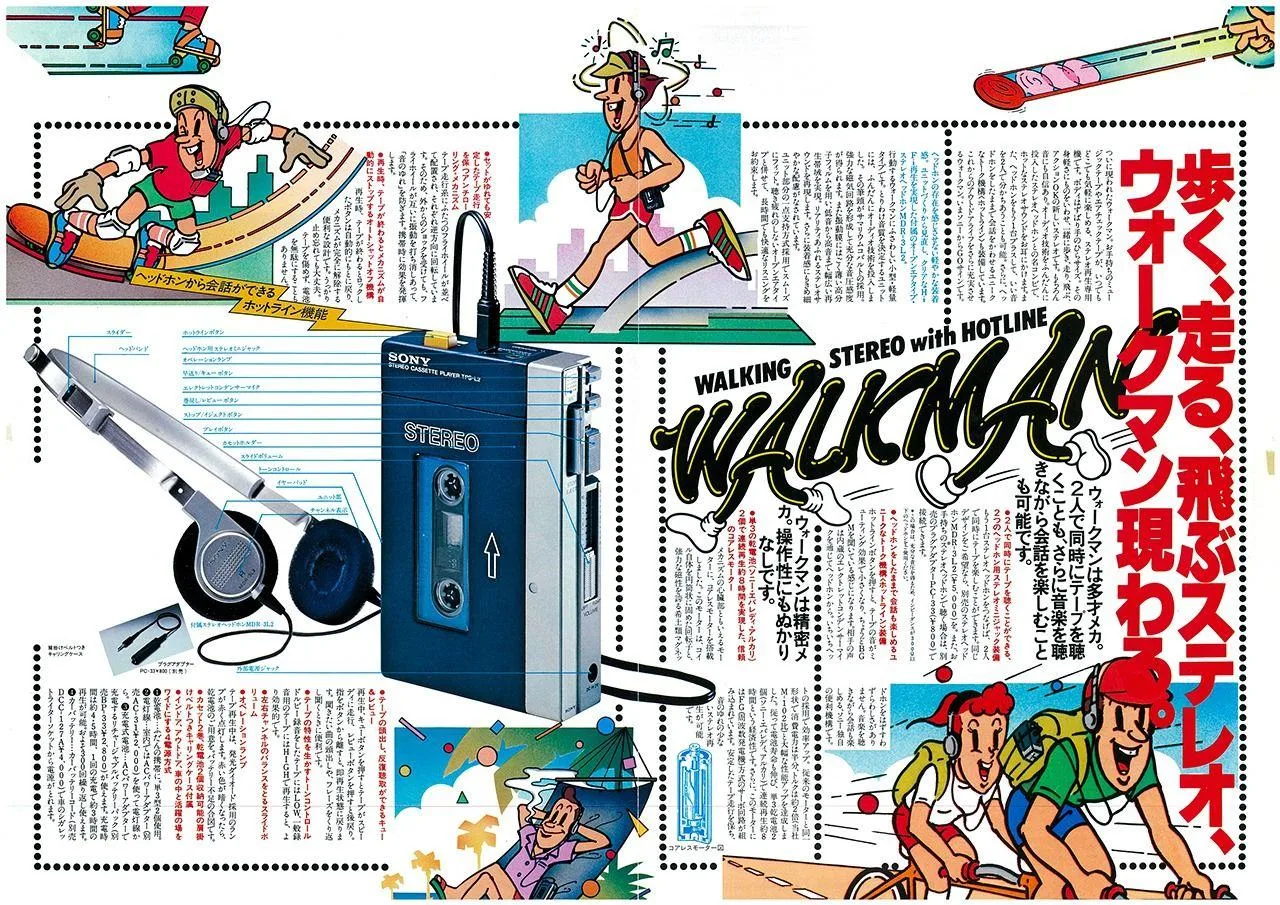
Sony launched the Walkman using an incredibly aggressive, experiential marketing campaign targeted squarely at youth culture. Instead of traditional static advertisements detailing technical specs, Sony hired actors, skateboarders, and joggers to traverse the busy streets of Tokyo, handing headphones to pedestrians so they could experience high-fidelity, portable stereo sound for themselves.
The technical drawings distributed to distributors emphasized the beautifully compact, folded gear train and the precision spring-loaded pinch rollers that allowed the tape mechanism to play smoothly even while the user was running.
Learn more about the development of the Walkman (Nippon.com)
The Walkman's journey showcases how material and market testing alters a product's DNA. The project shifted from a metal chassis to high-impact ABS plastic after structural stress testing showed that metal dented easily when dropped by active users. Additionally, during real-world user testing, the team realized that isolation could feel antisocial or dangerous on busy city streets. They looped back to the ideation phase and designed a mechanical orange button called the "Hot Line": when pressed, it lowered the music volume and activated a small built-in microphone so users could talk to each other without removing their headphones.