Material selection is where a design gets 'real' and commits. Almost everything that comes before it can be changed cheaply, but few things that come after material selection can. The material determines which manufacturing processes are available, what production costs, how heavy it is, how it fails, how it feels in the hand, and what happens to it once it is thrown away. It's a decision that quietly makes several others for you.
What B3.1 asks of you is justification rather than selection. Anyone can pick a material. The assessable skill in Paper 2 and your IA is explaining why that one and not any obvious alternatives. This is done using the properties from A3.1 alongside aesthetics, cost, availability and environmental impact, and being honest about what you traded away. Real selections are often compromises, and justification will never be as simple as stating that something was the best and only option. Learn to use an Ashby chart properly while you are here! There's an activity to help, and understanding them will seriously help with your ability to select materials and explain your choices.
Students must be able toIdentify appropriate materials based on their physical, chemical and mechanical properties.
Material selection begins with identifying which properties matter for the specific application. Designers must consider the operating environment (forces, temperature, moisture, UV exposure, chemical contact), the performance requirements (how strong, how stiff, how light), and the failure modes to avoid (fracture, corrosion, creep, fatigue).
Key properties to consider:
| Property | Why it matters | Example application |
|---|---|---|
| Strength (UTS, yield) | Resists fracture or permanent deformation under load | Structural beam, pressure vessel |
| Stiffness (Young's Modulus) | Resists elastic deflection; maintains shape | Aircraft wing spar, bicycle frame |
| Corrosion resistance | Survives chemical attack, moisture, salts | Marine fittings, food containers |
| UV tolerance | Resists degradation from ultraviolet light | Outdoor furniture, car dashboards |
| Thermal conductivity | Manages heat flow (high for heat sinks, low for insulation) | Heatsinks, building insulation |
| Durability / fatigue life | Survives repeated load cycles without failure | Springs, aircraft fuselage skin |
| Density | Affects weight, which impacts energy consumption and handling | Portable devices, vehicles |
In most real applications, no single material excels across every property: selection requires compromise. High strength often comes with high density; good corrosion resistance often comes with higher cost. The challenge is to find the material that best satisfies the ranked priorities for a specific product.
Ashby charts (material selection charts)
Developed by Professor Michael Ashby of Cambridge University in the 1990s, Ashby charts plot two material properties against each other on logarithmic scales. Each material (or material family) appears as a bubble or region. Logarithmic scales are used because material properties span many orders of magnitude: plotting rubber (E ≈ 0.01 GPa) and diamond (E ≈ 1000 GPa) on the same linear axis would make most materials invisible.
Ashby charts allow designers to:
- Screen all candidate materials simultaneously: those in a target region of the chart pass the filter.
- Visualise trade-offs: for example, a strength-vs-density chart reveals that high-strength materials tend to be dense, but some (CFRP, titanium alloys) break this trend.
- Compare the efficiency of different material families for a specific function.
- Conduct substitution studies when a preferred material becomes unavailable or too expensive.
Example property pair (Strength vs. density): Plot ultimate tensile strength (y-axis) against density (x-axis). Materials in the top-left corner are strong and light: ideal for aerospace and sports equipment. Steel is strong but dense (bottom-right); CFRP and titanium alloys are strong and light (top-left).
Example property pair (Corrosion potential vs. corrosion current density): Materials with lower corrosion current density (i_corr) corrode more slowly; materials with higher (more noble) corrosion potential (E_corr) are more resistant to oxidation. Materials towards the upper-left of this chart are preferred for corrosive environments.
Performance indices
A performance index is a combination of material properties: a formula that quantifies how efficiently a material meets a specific design requirement. By drawing design lines (lines of constant performance index value) on an Ashby chart, designers can quickly rank materials for a given function.
| Index | Formula | Meaning | Application |
|---|---|---|---|
| Specific strength | σᵤ / ρ | Strength per unit weight | Aircraft wings, racing car chassis: must be strong but light |
| Specific stiffness | E / ρ | Stiffness per unit weight | Bicycle frames, sailing masts, wind turbine blades |
| Fracture toughness | KIc (MPa·m½) | Resistance to crack propagation | Pressure vessels, safety-critical parts, aircraft skin |
| Thermal conductivity / cost | λ / Φ | Heat transfer per unit cost | Radiator fins, heat exchangers: maximise thermal performance within budget |
The design line technique: draw a straight line of slope equal to the performance index across the Ashby chart. Materials above the line (for maximisation problems) perform better. Shifting the line up screens increasingly superior materials.
Students must be able toIdentify appropriate materials based on texture, form and colour, which can also be enhanced by using a variety of finishing techniques.
A material that performs well mechanically but looks or feels wrong will fail in the market. Aesthetic considerations encompass all sensory qualities that influence how users perceive and relate to a product:
- Colour: Natural colour of a material or the colour achievable through finishes. Warm tones (wood, copper) signal craftsmanship and warmth; cool tones (brushed steel, anodised aluminium) signal precision and modernity.
- Texture: The surface feel and visual grain. Rough textures (hammered metal, leather-grained plastic) signal ruggedness; smooth textures (polished glass, mirror-finished steel) signal refinement.
- Form: How the material's properties (malleability, rigidity, translucency) enable or constrain the product's shape. Glass allows complex blown or cast forms; sheet steel enables crisp, geometric shapes.
- Sound: The acoustic quality of a material affects perception of quality. The solid "thunk" of a closing car door signals robustness; the rattling of thin plastic signals cheapness. Premium headphone housings use dense materials to improve perceived build quality.
- Smell: New leather, cut timber, and even fresh rubber carry olfactory associations. The "new car smell" is deliberately engineered; the smell of varnished wood is associated with luxury furniture.
These factors differentiate a product from competitors and give it personality or character: important for brand identity and premium pricing.
Finishing techniques that enhance aesthetics:
| Finish | Material | Aesthetic effect |
|---|---|---|
| Wood grain (natural or applied veneer) | Solid timber or MDF with veneer | Warm, organic, handcrafted; signals natural luxury |
| Polished marble | Marble or marble-effect composites | Smooth, reflective; associated with permanence and luxury |
| Brushed stainless steel | Austenitic stainless steel | Fine directional texture; hides fingerprints; modern, professional |
| Anodised aluminium | Aluminium alloys | Controlled colour range; hard, scratch-resistant surface; clean and contemporary |
| Mirror polish | Steel, brass, acrylic | High reflectivity; signals precision and premium quality |
| Powder coating | Metal substrates | Wide colour range; durable; matte, satin, or gloss options |
Important distinction: Corrosion protection (galvanising, passivation, epoxy coating) is a functional finish, not an aesthetic one: it improves durability, not appearance. Similarly, a heat treatment to improve hardness is functional. Only finishes primarily chosen for their visual or tactile qualities are classified as aesthetic.
Aesthetic selection also applies to material finishes used in product interiors: the felt-lined interior of a jewellery box, the soft-touch rubber grip on a power tool, or the piano-black plastic of a premium remote control all use material choices to signal quality and create an emotional response.
Students must be able toIdentify appropriate materials based on cost, availability and sustainability.
Beyond properties and aesthetics, four contextual factors shape which material is ultimately chosen:
1. Cost: lifecycle, not just purchase price
The initial purchase price of a material is only part of the cost story. Lifecycle cost includes:
- Acquisition: Raw material cost, processing, and transportation to the factory.
- Manufacturing: How easily the material can be machined, moulded, welded, or cast. A material that requires expensive tooling or long processing times adds to unit cost even if the raw material is cheap.
- In-service maintenance: Some materials require regular painting, sealing, or re-treatment (wooden outdoor furniture, mild steel in damp environments). Others are maintenance-free for decades (anodised aluminium, HDPE).
- End-of-life disposal or recycling: Landfill costs, recycling income (aluminium, steel), or hazardous waste disposal fees (some coatings, composites).
A stainless steel water bottle costs more upfront than a plastic one but lasts 10+ years, reducing replacement purchases. Over a 10-year lifecycle, the stainless steel option may be cheaper per use.
2. Availability
- Global vs. local sourcing: A material available locally has lower transport emissions, shorter lead times, and less supply chain risk. Materials sourced from a single country or mine are vulnerable to geopolitical disruption.
- Renewable vs. finite: Bamboo regenerates in 3–5 years; steel relies on iron ore mined from finite deposits. Renewable availability aligns with circular economy thinking.
- Recyclability: Aluminium and steel can be recycled indefinitely without significant property loss. Many composite materials (CFRP) cannot yet be economically recycled: their fibres are landfilled or incinerated.
- Form availability: Some materials are only available in limited sizes or thicknesses. A designer may need to choose a different material if the required section size or form factor is not commercially available.
3. Environmental impact (sustainability)
- Embodied energy and carbon footprint: The energy consumed and CO₂ emitted to extract, process, and manufacture a material. Aluminium has high embodied energy in primary production but is low when made from recycled material. Timber sequesters carbon during growth, making it potentially carbon-negative.
- Resource depletion: Rare earth elements, cobalt, and lithium are critical for electronics and batteries: their finite supply and geopolitically concentrated mining raise sustainability concerns.
- Pollution: Processing some materials generates toxic byproducts (chrome plating, PVC production with vinyl chloride monomer). Environmental regulations may restrict or ban certain materials in specific markets.
- End-of-life pathway: Does the material biodegrade, decompose into safe compounds, or persist in the environment? PLA bioplastic breaks down under industrial composting conditions; conventional polyethylene persists for hundreds of years.
4. Manufacturability
The chosen material must be compatible with the available manufacturing processes, since some materials are far easier to machine, mould or weld than others. Key considerations:
- Thermoplastics (HDPE, ABS) can be injection moulded at high volume and low cost; thermosets (epoxy, polyester) are cast or laminated but cannot be re-melted.
- Aluminium alloys machine easily; titanium is harder to machine, requiring slower speeds and specialised tooling.
- Some materials have highly anisotropic properties: timber is much stronger along the grain than across it; CFRP strength depends on fibre orientation. This constrains design geometry.
- Joining methods matter: some polymers cannot be welded, only bonded with adhesive; ceramics cannot be welded at all.
The triple bottom line is a framework for judging a decision against three accounts rather than one. Traditional business decisions are judged on Profit alone: does this material cost less or perform better for the money? The triple bottom line adds two more accounts: People (does the material harm workers, users or communities, from extraction through to disposal?) and Planet (what is the carbon, water and waste footprint across the material's life?).
The four contextual factors above map directly onto this framework: cost and manufacturability sit mostly under Profit, environmental impact sits under Planet, and availability and the safety implications of resource extraction sit partly under People. A material that wins on Profit but fails on Planet or People is not automatically the right choice; it is a trade-off that the designer must make explicit and justify, rather than ignore.
- Profit: purchase price, processing cost, tooling, lifecycle cost
- People: worker safety during extraction and manufacturing, user safety and health, community impact of mining or disposal
- Planet: embodied energy, carbon footprint, resource depletion, end-of-life pathway
Develop a product from concept to market and watch a corner cut early resurface as a failed safety test, a certification refusal or a recall.
Students must be able toJustify their choice of materials using appropriate research methods.
Material choices must be justified, not simply asserted. A claim that "aluminium is the best material for this bracket" is incomplete without evidence comparing it to alternatives across the relevant criteria. Research provides that evidence.
Primary research generates first-hand, original data through direct investigation. In material selection, primary research methods include:
- Physical testing of samples: Tensile testing (measuring UTS and yield strength), Charpy or Izod impact testing (toughness), Brinell or Vickers hardness testing, bend tests, and corrosion resistance tests (salt spray chamber). First-hand data is specific to the actual material batch and condition in question.
- User testing: Presenting material samples to target users and recording their aesthetic and tactile preferences. Which texture feels premium? Which weight feels right? This data cannot be found in a database.
- Prototype testing: Building a physical prototype from the candidate material and testing it in conditions that simulate real use. A 3D-printed bracket made from PLA does not test steel, but a steel prototype does.
- Observation: Examining how existing products have performed in the field: photographing corrosion, wear, or failure modes.
Secondary research uses existing published data, gathered by others. In material selection, secondary sources include:
- Material property databases: MatWeb (matweb.com), ASM International's Handbook, CES EduPack (the software that implements Ashby charts). These provide tabulated values for thousands of materials.
- Manufacturer data sheets: Published by material suppliers. These provide precisely tested property values for specific grades and thicknesses, including processing conditions.
- Academic journals: Peer-reviewed papers on material performance in specific environments (e.g., corrosion of aluminium in marine conditions, fatigue behaviour of CFRP under cyclic loading).
- Life Cycle Assessment (LCA) databases: Environmental impact data for materials across extraction, processing, use, and end-of-life (e.g., Ecoinvent database, EPA reports, European Commission LCA tools).
- Standards and regulations: Industry standards (ISO, ASTM, EN) define minimum material requirements for specific applications. EU food contact regulations (Regulation 10/2011) and REACH chemical restrictions are secondary sources for material compliance.
Combining both: A rigorous material selection report uses both. Secondary research provides the broad screening (Ashby charts reduce 10,000 materials to 20 candidates); primary research verifies the top candidates in the specific operating context. Together they produce a justified, defensible decision.
Typical justification structure:
- Define selection criteria and rank them by importance (e.g., specific stiffness first, cost second, corrosion resistance third).
- Use secondary research (Ashby charts, databases) to screen to 3–5 candidates.
- Use primary research (sample testing, user tests) to discriminate between the finalists.
- Document the decision with data, not just opinion.
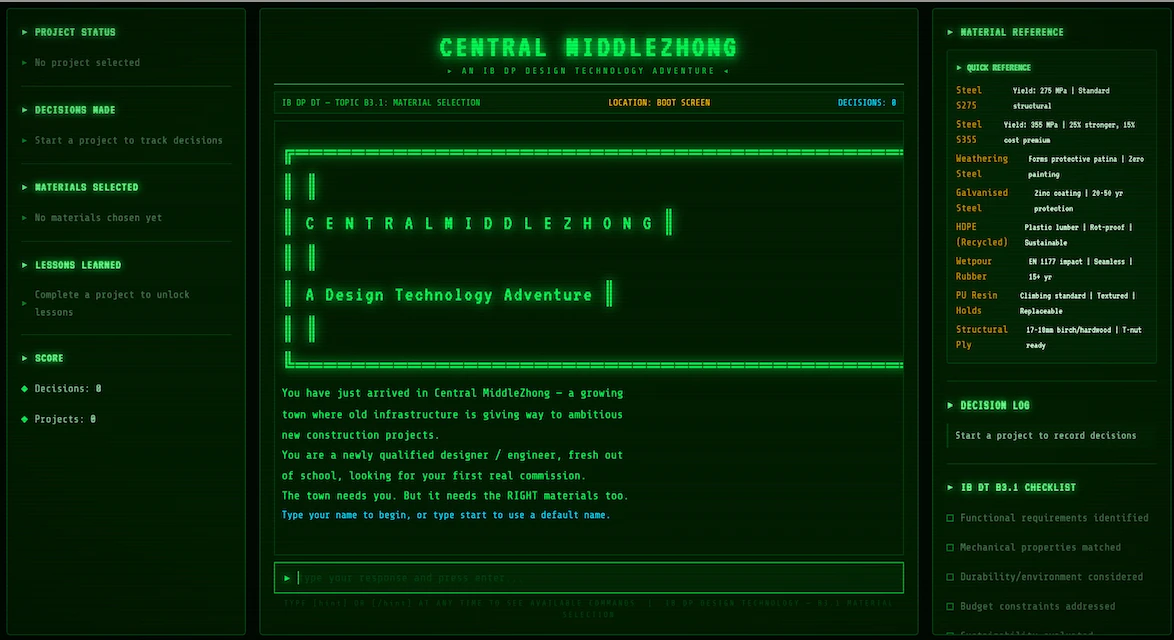
The town of Central Middlezhong needs your material expertise! This is an old-school text adventure where every material choice has a consequence.
Ten questions covering the learning objectives for this topic. Select one answer per question, then click "Check all answers" to see your score and the explanations.
A wind turbine blade is 80 m long and rotates about a horizontal axis. It is a hollow shell with internal spars. Every rotation reverses the direction of gravity loading on the blade, and the turbine runs for twenty years without the blade being replaced.
Blades are laid up as a composite of glass fibre in an epoxy matrix. Some manufacturers use carbon fibre in the spar caps only.
Table 1: Candidate materials for the blade shell
| Property | Glass/epoxy | Carbon/epoxy | Aluminium alloy |
|---|---|---|---|
| Density (kg/m³) | 1900 | 1600 | 2700 |
| Young's modulus (GPa) | 39 | 135 | 69 |
| Tensile strength (MPa) | 1000 | 1500 | 310 |
| Relative cost per kg | 1 | 9 | 2 |
| Fatigue resistance | Good | Excellent | Moderate |
(a) State the property combination that matters most for a component that must be stiff and light, see Table 1. [1]
(b) Outline why fatigue resistance is a decisive property for this blade, see Table 1. [2]
(c) Explain why carbon fibre is used only in the spar caps rather than throughout the blade, see Table 1. [3]
(a) Specific stiffness, meaning Young's modulus relative to density.
(b) The blade turns continuously for twenty years, and every rotation reverses the direction of the gravity load on it, so the material is cycled through hundreds of millions of load reversals. A material can be strong enough to survive any single one of those loads and still crack under repeated cycling well below its tensile strength, so the number that governs the design is fatigue life rather than strength.
(c) The spar caps carry almost all the bending load, so that is where stiffness pays for itself. Carbon is roughly three and a half times stiffer than glass at a lower density, which is exactly what a spar needs, and placing it at the top and bottom of the section puts it as far from the neutral axis as possible, where each kilogram does the most work. The shell between the spars is mainly carrying aerodynamic surface loads and holding the aerofoil shape, so its stiffness barely affects the blade's deflection, and carbon there would buy very little. Against that, carbon costs nine times as much per kilogram as glass, and an 80 m blade is a large amount of material, so using it everywhere would raise the blade cost far more than it improves the turbine's output. Confining the expensive material to the region where the property is needed is what makes the blade affordable.
(a) • Specific stiffness ✓
• Stiffness-to-weight ratio ✓
• Young's modulus relative to density ✓
Award [1] for the correct property combination up to [1 max].
(b) Materials are selected for specific applications based on their properties.
• The blade turns continuously for twenty years ✓
• Every rotation reverses the direction of the gravity load ✓
• The material sees hundreds of millions of load cycles ✓
• A material can survive any single load and still crack under repeated cycling ✓
• Fatigue failure occurs at stresses well below the tensile strength ✓
• The blade is not replaced during the turbine's life, so failure is not recoverable ✓
• Access for inspection and repair 80 m up is difficult and costly ✓
Award [1] for each relevant brief point on why fatigue resistance is decisive up to [2 max]. The response must refer to cyclic loading for full marks.
(c) Materials are selected based on their properties, and additional factors including cost influence the selection.
Where stiffness is needed:
• The spar caps carry almost all the bending load ✓
• Carbon is about 3.5 times stiffer than glass, 135 GPa against 39 GPa ✓
• It achieves this at a lower density, 1600 against 1900 kg/m³ ✓
• Placing it furthest from the neutral axis is where each kilogram does the most work ✓
Where it is not:
• The shell carries aerodynamic surface loads and holds the aerofoil shape ✓
• Shell stiffness barely affects the blade's overall deflection ✓
• Carbon in the shell buys very little performance ✓
Cost:
• Carbon costs nine times as much per kilogram as glass ✓
• An 80 m blade uses a very large mass of material, so the multiplier is severe ✓
• Full carbon would raise blade cost more than it improves turbine output ✓
• Confining the expensive material to where the property is needed keeps the blade affordable ✓
Award [1] for each relevant reason / cause explaining the selective use of carbon fibre up to [3 max]. Award a maximum of [2] where the response argues only from cost and does not address where stiffness is needed.
A hospital is specifying curtains for the bays around beds. The curtain must screen a patient, hang from a ceiling track, and be changed and laundered. Infection control requires curtains to be replaced or washed at 71 °C on a schedule, and immediately after certain infections.
Two options are under consideration.
Table 2: Two curtain options
| Woven polyester, launderable | Nonwoven polypropylene, disposable | |
|---|---|---|
| Cost per curtain | £38 | £6 |
| Service life | 75 wash cycles | Single use, changed every 6 months |
| Wash temperature tolerated | 71 °C | — |
| Mass | 640 g | 210 g |
| Colour range | Wide, colourfast | Limited, fades |
| End of life | Recyclable if unmixed | Incinerated as clinical waste |
(a) State one aesthetic characteristic in Table 2 that differs between the two options. [1]
(b) Describe why the ability to withstand 71 °C is a required property rather than a desirable one, see Table 2. [2]
(c) Justify a material selection for a hospital replacing curtains across 400 beds, see Table 2. [3]
(a) Colour range: the polyester is wide and colourfast, the polypropylene limited and prone to fading.
(b) The wash temperature is set by infection control to kill organisms on the fabric, so a material that cannot survive 71 °C cannot be decontaminated by the process the hospital uses. That makes it a requirement the material either meets or fails, with no partial credit, because a curtain that degrades in the wash is not a slightly worse curtain, it is one that cannot be put back into a clinical area.
(c) The launderable polyester is the better selection for a hospital of this size. On unit cost the disposable looks far cheaper at £6 against £38, but the comparison that matters is cost per year in service, and 75 wash cycles against a six month replacement means the polyester is reused many times over while the polypropylene is bought again twice a year across all 400 beds. The polyester also meets the 71 °C requirement, so it can be decontaminated on demand after an infection rather than only on a schedule, which is the clinically important capability. Its colourfastness matters more than it appears to, because a faded curtain in a ward reads as neglect to patients and families and affects confidence in the ward's cleanliness. The disposable option wins on immediate handling, since it is a third of the mass and needs no laundry contract, and it would be the right choice for a temporary facility or an outbreak, but for a permanent 400 bed hospital its whole-life cost and the incineration of every curtain as clinical waste make it the weaker selection.
(a) • Colour range / colourfastness ✓
• Texture, woven against nonwoven ✓
• Appearance over time, fading ✓
Award [1] for one aesthetic characteristic supported by Table 2 up to [1 max]. Do not credit cost, mass or service life.
(b) Materials are selected for specific applications based on their properties, and some properties are set by regulation rather than by preference.
• The temperature is set by infection control to kill organisms on the fabric ✓
• A material that cannot survive 71 °C cannot be decontaminated by the hospital's process ✓
• The requirement is binary: the material either withstands it or is unusable ✓
• A curtain that degrades in the wash cannot be returned to a clinical area ✓
• Patient safety depends on it, so no trade-off against cost is available ✓
• Compliance with infection control policy is mandatory for the hospital ✓
Award [1] for each detail, leading to an account of why the wash temperature is a requirement rather than a preference, up to [2 max].
(c) The selection of materials for a specific purpose can be justified through primary and secondary research, weighing properties, aesthetics and additional factors.
Credit a justified selection of either material. Indicative content for polyester:
• Unit cost is misleading; cost per year in service is the relevant comparison ✓
• 75 wash cycles against replacement twice a year favours polyester across 400 beds ✓
• It meets the 71 °C requirement, so it can be decontaminated on demand after an infection ✓
• On-demand decontamination is the clinically important capability ✓
• Colourfastness matters because a faded curtain reads as neglect and affects confidence in cleanliness ✓
• Recyclable if unmixed, against incineration of every disposable curtain as clinical waste ✓
Indicative content for polypropylene:
• A third of the mass, so easier and faster for staff to change ✓
• No laundry contract, transport or storage of soiled curtains ✓
• No risk of a curtain being returned to service inadequately washed ✓
• Appropriate for a temporary facility or during an outbreak ✓
• Low capital outlay, which suits a constrained budget ✓
Award [1] for each valid reason / piece of evidence supporting the selection made up to [3 max]. Credit either selection provided it is justified from Table 2. Award a maximum of [2] where the response argues only from unit cost.
A company is designing a reusable coffee cup sold to commuters. It must be carried in a bag, hold 340 ml at 90 °C, survive being dropped on a pavement, and be washed in a dishwasher for at least two years.
The lid is a separate part with a sliding closure.
(a) Identify two properties the cup body material must have. [2]
Table 3: Candidate materials for the cup body
| Property | Borosilicate glass | Stainless steel | Polypropylene | Bamboo fibre composite |
|---|---|---|---|---|
| Density (kg/m³) | 2230 | 7900 | 905 | 1300 |
| Thermal conductivity (W/m K) | 1.1 | 16 | 0.2 | 0.3 |
| Impact resistance | Poor | Excellent | Good | Moderate |
| Dishwasher safe | Yes | Yes | Yes, may warp | No, delaminates |
| Taste transfer | None | None | Absorbs over time | Absorbs |
| Relative cost | 2 | 4 | 1 | 2 |
(b) Outline why bamboo fibre composite fails the specification, see Table 3. [2]
The marketing team wants the cup to look and feel like a ceramic café cup, and wants the drink to be visible. It also wants the outside of the cup to be comfortable to hold without a sleeve.
(c) Describe the conflict between the marketing requirements and the properties in Table 3. [2]
The company must choose one material and commit to a mould or forming tool. It sells through commuter rail stations, and its stated position is that a reusable cup is only worth making if it displaces enough disposable cups to justify its own manufacture.
(d) Explain how the company should weigh the competing factors in selecting the cup body material, see Table 3. [4]
(a) Impact resistance, to survive being dropped on a pavement, and resistance to hot water and detergent, to survive repeated dishwasher cycles.
(b) It is not dishwasher safe and delaminates, which fails the requirement to be washed for two years, and because the fibres absorb flavours the cup would taste of yesterday's coffee. Both are failures against stated requirements rather than weaknesses to be traded off, so the material is eliminated regardless of how it performs elsewhere.
(c) Visibility of the drink requires a transparent body, which among these materials means only borosilicate glass, and glass has poor impact resistance, which conflicts directly with surviving a drop on a pavement. A comfortable outside surface requires low thermal conductivity, and stainless steel at 16 W/m K is by far the worst on that measure while being the only material with excellent impact resistance, so the two marketing requirements point at opposite ends of the table.
(d) The decision should start by separating requirements from preferences, because the two are not tradeable against each other.
Dishwasher survival and taste neutrality are requirements, and they eliminate bamboo composite outright and put polypropylene under serious doubt, since it may warp and absorbs flavour over time. A cup that tastes stale after six months does not get carried, and a cup that is not carried displaces no disposables, which defeats the company's own stated purpose. That leaves glass and steel.
Between those, the deciding factor is which failure the product cannot survive. Glass gives the marketing team everything it wants: it is transparent, it feels like ceramic, and at 1.1 W/m K it is far more comfortable to hold than steel. Its impact resistance is poor, and a commuter cup is carried in a bag on a rush hour platform, so being dropped is not an edge case but a normal event. A cup that breaks in the first month is worse environmentally than a disposable, because its manufacture is amortised over almost no uses.
Steel is the opposite trade. It survives everything, it is taste neutral, it is dishwasher safe, and at four times the cost of polypropylene it is the most expensive option, which raises the purchase price and so reduces how many people buy one. Its real weakness is that 16 W/m K makes the outside too hot to hold, and it hides the drink.
Steel is the correct selection, because the thermal problem is solvable within the design and the impact problem is not. A double wall, a silicone band or a formed grip fixes the heat without changing the material, whereas nothing in the design can make glass survive a pavement. The company should accept the higher cost and the loss of visibility, since the decisive test is how many uses the cup actually delivers, and a cup that survives two years of commuting displaces enough disposables to justify itself while a broken one does not.
(a) Materials are selected for specific applications based on their properties.
• Impact resistance / toughness ✓
• Resistance to hot water and detergent ✓
• Low thermal conductivity ✓
• Food safety / non-toxicity ✓
• Low density ✓
• Resistance to staining or taste transfer ✓
• Thermal stability at 90 °C ✓
Award [1] for each relevant property identified up to [2 max].
(b) • It is not dishwasher safe and delaminates ✓
• The specification requires dishwasher washing for at least two years ✓
• The fibres absorb flavours, so the cup would taste of previous drinks ✓
• Impact resistance is only moderate, against a requirement to survive a drop ✓
• These are failures against stated requirements, not weaknesses to be traded off ✓
• The material is therefore eliminated regardless of its other properties ✓
Award [1] for each relevant brief point on why bamboo fibre composite fails up to [2 max]. Credit responses that distinguish a failed requirement from a poor score.
(c) Materials are selected based on aesthetic characteristics as well as properties, and the two can conflict.
• Visibility of the drink requires transparency, which among these materials means glass only ✓
• Glass has poor impact resistance, conflicting with surviving a drop on a pavement ✓
• A comfortable outer surface requires low thermal conductivity ✓
• Stainless steel at 16 W/m K is the worst on that measure ✓
• Steel is also the only material with excellent impact resistance ✓
• The two marketing requirements therefore point at opposite ends of the table ✓
• A ceramic feel suggests glass or a coated surface rather than bare metal ✓
Award [1] for each detail, leading to an account of the conflict, up to [2 max]. The response must connect a marketing requirement to a property in Table 3.
(d) Additional factors influence the selection and application of materials in a specific context, and selection is justified by weighing them against the design's purpose.
Separate requirements from preferences:
• Dishwasher survival and taste neutrality are requirements, not tradeable against cost or looks ✓
• These eliminate bamboo composite and cast doubt on polypropylene, which may warp and absorbs flavour ✓
• A cup that tastes stale is not carried, and a cup not carried displaces no disposables ✓
• That defeats the company's own stated justification for the product ✓
The glass case:
• Transparent, ceramic-like, and at 1.1 W/m K comfortable to hold ✓
• Delivers every marketing requirement ✓
• Poor impact resistance against a product carried in a bag on a rush hour platform ✓
• Being dropped is a normal event for this product, not an edge case ✓
• A cup broken in month one is environmentally worse than a disposable, since manufacture is amortised over almost no uses ✓
The steel case:
• Excellent impact resistance, taste neutral and dishwasher safe ✓
• Four times the cost of polypropylene, raising price and reducing uptake ✓
• 16 W/m K makes the outside uncomfortable to hold ✓
• Opaque, so the drink is not visible ✓
• Highest density at 7900 kg/m³, so the heaviest to carry ✓
The deciding principle:
• Choose the material whose weakness the design can compensate for ✓
• A double wall, silicone band or formed grip solves the heat without changing material ✓
• Nothing in the design can make glass survive a pavement ✓
• The decisive measure is uses delivered, since that is what displaces disposables ✓
Award [1] for each relevant detail / reason / cause relating to how the competing factors should be weighed up to [4 max]. Credit any selection that is justified. Award a maximum of [3] where the response does not weigh at least two materials against each other. Credit responses that relate the choice to the company's stated purpose.
Linking Questions
- Which factors of ergonomics influence the choice of a material? (A1.1)
- How can user-centred research methods influence the selection of a material? (A2.1)
- To what extent does material selection rely on the desired manufacturing techniques? (A4.1)
- How do designers prioritize material selection as part of the design process? (B2.1)
- Which aspects of material selection do designers have to consider to take a product beyond usability? (C1.3)
- How does the selection of a material influence whether a product can meet the requirements of design for sustainability or design for a circular economy? (C2.1) (C2.2)
- How does the choice of design for manufacture strategies affect the requirements for material selection? (C4.1)
- To what extent are material selection and production systems interlinked? (B4.1)